
Survey Highlights: 2026 NSSE
Gettysburg College has participated in the National Survey of Student Engagement (NSSE) every three years since 2005, as part of the institutional assessment of student learning. From mid-March 2026 to mid-April 2026, the Office of Institutional Research (OIR) conducted NSSE, inviting all first-year (FY) students (Fall 2025 entering cohort) and May 2026 graduating seniors to take the survey. Gettysburg's response rate for both FY students and seniors was 39%, exceeding the national average and comparison group averages.
2026 NSSE results provide a snapshot of FY students' and seniors' levels of engagement, perceptions of institutional environments, and other aspects of college experience during the 2025-26 Academic Year. Based on the 2026 NSSE responses, NSSE staff researchers identified many statistically significant differences between Gettysburg and the three Comparison Groups noted below. Gettysburg scored higher than one or more Comparison Groups (i.e., Gettysburg compared favorably). Specifically, Gettysburg’s average scores were compared with the means of the following three groups (consisting of schools which participated in the 2026 NSSE):
- Selected Peers (consisting of 14 private liberal arts colleges selected by the OIR for peer comparisons; see Note for the list of schools).
- Carnegie Class (consisting of 42 baccalaureate colleges with the same Institutional Classification)
- NSSE 2026 (consisting of 422 institutions; i.e., national average).
Highlighted below are summary measures or single items on which a statistically significant mean difference was found between Gettysburg and the averages of Selected Peers.
Engagement Indicators
NSSE measures student engagement through 10 Engagement Indicators. For each school, NSSE staff researchers calculated an overall score for each Engagement Indicator (summary measure based on multiple single items) based on its students' responses.
Compared with their counterparts in the group - Selected Peers, Gettysburg FY students' overall score was significantly higher than the average of Selected Peers on four Engagement Indicators; Gettysburg seniors' overall score was significantly higher than the average of Selected Peers on four Engagement Indicators as well. See Table below:
| Engagement Indicator | FY Students: Gettysburg’s overall score was significantly higher than that of Selected Peers? | Seniors: Gettysburg’s overall score was significantly higher than that of Selected Peers? |
|---|---|---|
| Higher-Order Learning | No difference | No difference |
| Reflective & Integrative Learning | No difference | No difference |
| Learning Strategies | No difference | No difference |
| Quantitative Reasoning | Yes | Yes |
| Collaborative Learning | No difference | No difference |
| Discussions with Diverse Others | No difference | Yes |
| Student-Faculty Interaction | Yes | No difference |
| Effective Teaching Practices | No difference | No difference |
| Quality of Interactions | Yes | Yes |
| Supportive Environment | Yes | Yes |
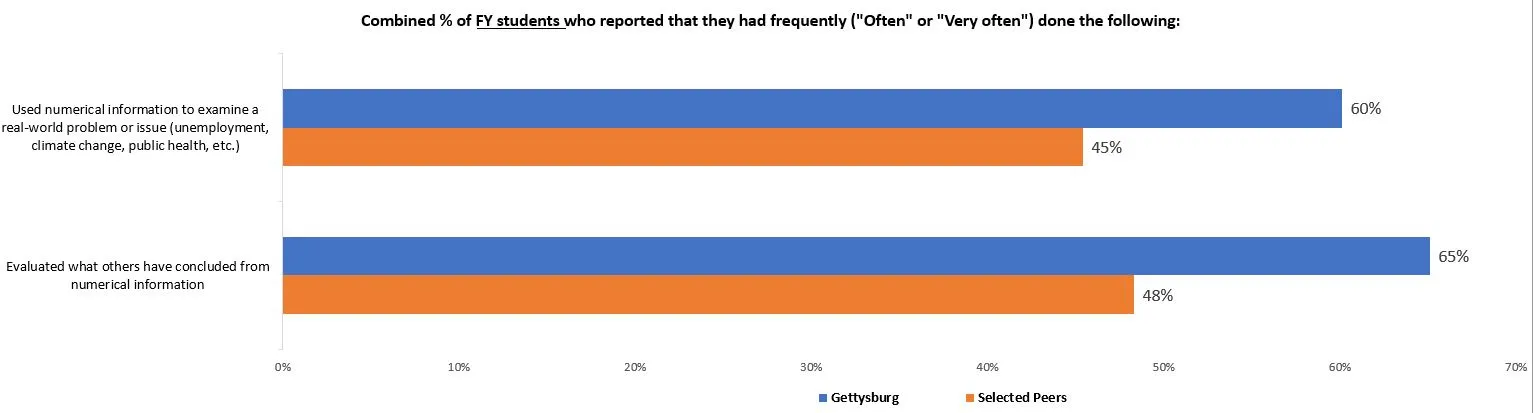
Quantitative Reasoning
NSSE question: During the current school year, about how often have you done the following? (Rating Scale: Never (1)—Sometimes (2)—Often (3)—Very often (4))
| Question | Gettysburg | Selected Peers |
|---|---|---|
| Used numerical information to examine a real-world problem or issue (unemployment, climate change, public health, etc.) | 60% | 45% |
| Evaluated what others have concluded from numerical information | 65% | 48% |
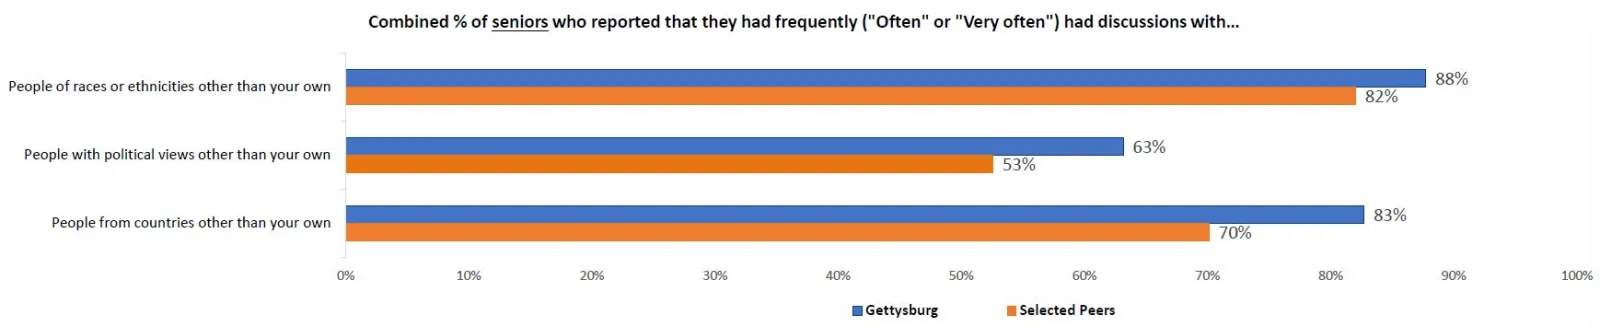
Discussions with Diverse Others
NSSE question: During the current school year, about how often have you had discussions with people from the following groups? (Rating Scale: Never (1)—Sometimes (2)—Often (3)—Very often (4))
| Question | Gettysburg | Selected Peers |
|---|---|---|
| People of races or ethnicities other than your own | 88% | 82% |
| People with political views other than your own | 63% | 53% |
| People from countries other than your own | 83% | 70% |
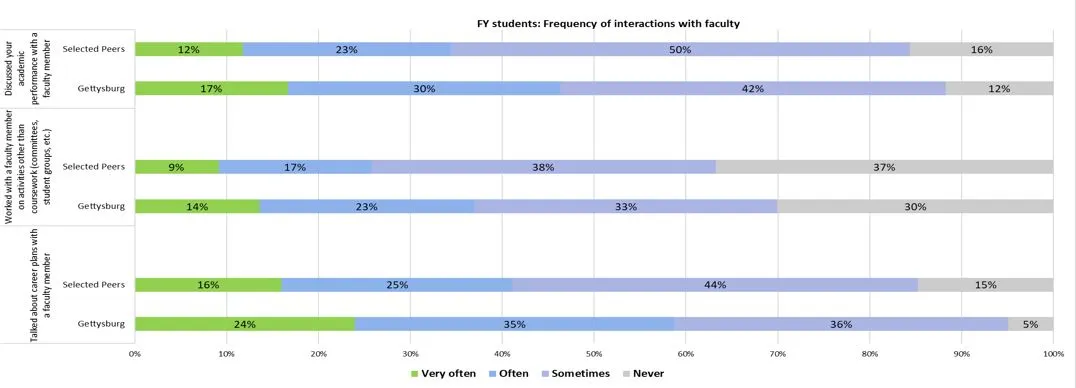
Student-Faculty Interaction
NSSE question: During the current school year, about how often have you done the following? (Rating Scale: Never (1)—Sometimes (2)—Often (3)—Very often (4))
| Frequency | Talked about career plans with a faculty member | Worked with a faculty member on activities other than coursework (committees, student groups, etc.) | Discussed your academic performance with a faculty member | |||
|---|---|---|---|---|---|---|
| Gettysburg | Selected Peers | Gettysburg | Selected Peers | Gettysburg | Selected Peers | |
| Very often | 24% | 16% | 14% | 9% | 17% | 12% |
| Often | 35% | 25% | 23% | 17% | 30% | 23% |
| Sometimes | 36% | 44% | 33% | 38% | 42% | 50% |
| Never | 5% | 15% | 30% | 37% | 12% | 16% |
NSSE question: Indicate the quality of your interactions with the following people at your institution. (Rating scale: 1 (Poor) to 7 (Excellent))
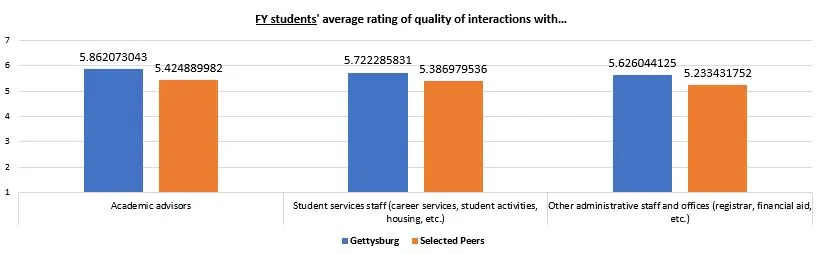
FY students' average rating of quality of their interactions with …
Academic advisors
Student services staff (career services, student activities, housing, etc.)
Other administrative staff and offices (registrar, financial aid, etc.)
| Gettysburg | Selected Peers |
|---|---|
| 5.9 | 5.4 |
| 5.7 | 5.4 |
| 5.6 | 5.2 |
View results on Quality of Interactions reported by seniors
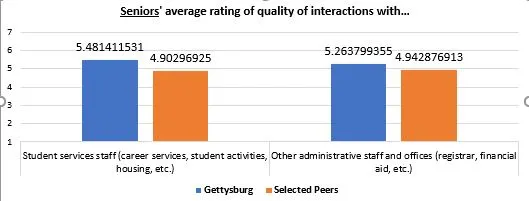
Seniors' average rating of quality of their interactions with...
Student services staff (career services, student activities, housing, etc.)
Other administrative staff and offices (registrar, financial aid, etc.)
| Gettysburg | Selected Peers |
|---|---|
| 5.5 | 4.9 |
| 5.3 | 4.9 |
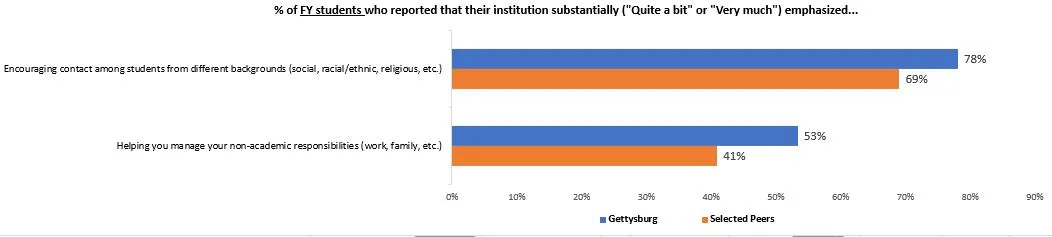
| % of seniors reporting their institution substantially ("Very much" or "Quite a bit") emphasized... | Gettysburg | Selected Peers |
|---|---|---|
| Encouraging contact among students from different backgrounds (social, racial/ethnic, religious, etc.) | 68% | 63% |
| Providing opportunities to be involved socially | 84% | 78% |
| Providing support for your overall well-being (recreation, health care, counseling, etc.) | 81% | 71% |
| Helping you manage your non-academic responsibilities (work, family, etc.) | 49% | 32% |
NSSE question: How much has your experience at this institution contributed to your knowledge, skills, and personal development in the following areas? (Rating Scale: Very little (1)—Some (2)—Quite a bit (3)—Very much (4))
NSSE lists 10 Learning Outcomes. Compared with their counterparts in the group - Selected Peers, on average, Gettysburg’s FY students reported more gains on five Learning Outcomes: Analyzing numerical and statistical information; Acquiring job- or work-related knowledge and skills; Understanding people of other backgrounds (economic, racial/ethnic, political, religious, nationality, etc.); Solving complex real-world problems; Being an informed and active citizen. Gettysburg’s seniors reported more gains on seven Learning Outcomes - see chart below for seniors' results.
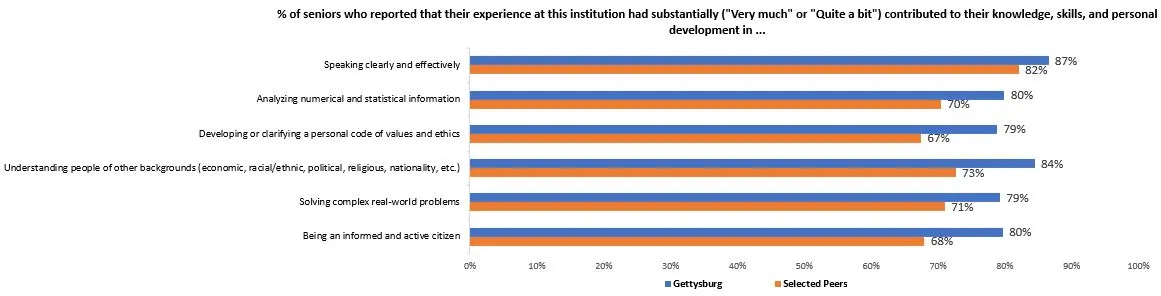
| Area | Gettysburg | Selected Peers |
|---|---|---|
| Speaking clearly and effectively | 87% | 82% |
| Analyzing numerical and statistical information | 80% | 70% |
| Developing or clarifying a personal code of values and ethics | 79% | 67% |
| Understanding people of other backgrounds (economic, racial/ethnic, political, religious, nationality, etc.) | 84% | 73% |
| Solving complex real-world problems | 79% | 71% |
| Being an informed and active citizen | 80% | 68% |
Gettysburg seniors also scored higher on the Learning Outcome "Working effectively with others", with an average score of 3.3 vs. 3.2 for Selected Peers.
Note:
*Selected Peers: Colby College; Colgate Univ., DePauw Univ., Denison Univ., Dickinson College; Furman Univ., Hamilton College; Juniata College; Kenyon College; Lawrence Univ., Rhodes College; The Univ. of the South; Ursinus College; Whitman College (WA).
More info about NSSE can be found here:
https://nsse.indiana.edu/nsse/survey-instruments/index.html