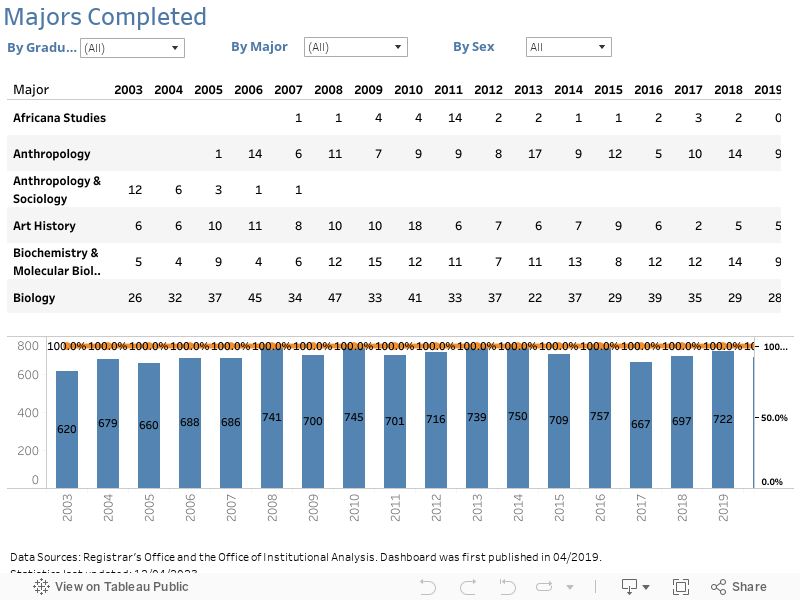
The following interactive dashboard presents 20 years' completions data by Graduating Class, Major, and Sex (2007 - 2027). Students completing multiple majors were counted in all of their majors; the denominator used in calculating the percentage was the total number of majors completed by a graduating class (not the unduplicated headcount of individuals in that graduating class). This dashboard was first published in 04/2019 and the statistics were last updated on 07/06/2026.
Please click the drop-down menus below to explore. Use the scroll bar on the right to navigate the summary table. To find out the most common fields of study in a given graduating class, hover the mouse over the corresponding column header in the table below and then click on the Sort Descending icon.