Gettysburg College has participated in the National Survey of Student Engagement (NSSE) every three years since 2005, as part of the institutional assessment of student learning. From March 15, 2023 to April 11, 2023, the Office of Institutional Analysis conducted the NSSE, inviting all first-year (FY) students (Fall 2022 entering cohort) and seniors (both graduating and non-graduating) to take the survey. NSSE results provide a snapshot of these students' levels of engagement, perceptions of institutional environments, learning outcomes, and other aspects of their college experience. Gettysburg FY response rate was 35%; senior response rate, 27%; both exceeded the national average.
NSSE staff researchers compared Gettysburg’s average scores with those of the Selected Peers* (peer group averages; 17 private liberal arts colleges which participated in the 2023 NSSE and selected by Gettysburg for peer comparisons; see Note). Overall, Gettysburg 2023 NSSE results were similar to the group averages of the Selected Peers. Meanwhile, NSSE results indicate many distinctive strengths (areas of distinction) of Gettysburg—areas in which Gettysburg results compared favorably with those of Selected Peers.
Furthermore, NSSE staff researchers compared Gettysburg’s average scores with those of the High-Preforming Institutions—Top 10% Institutions and Top 50% Institutions**.
Highlighted below are comparisons based on data collected from FY students, specifically, (1) comparisons between Gettysburg and Selected Peers; and (2) comparisons between Gettysburg and the Top 10% Institutions and Top 50% Institutions. All the items highlighted below are those on which a statistically significant mean difference was found between Gettysburg and each group.
1. Engagement Indicators: Comparisons with Selected Peers
NSSE measures student engagement through 10 Engagement Indicators. For each school, NSSE staff researchers calculated an overall score for each Engagement Indicator (summary measures based on multiple single items on the survey) based on its students' responses. Compared with Selected Peers: Gettysburg FY students' overall score was similar on eight Engagement Indicators; Gettysburg outperformed Selected Peers on two Engagement Indicators: Discussions with Diverse Others and Student-Faculty Interaction; specifically, Gettysburg FY students reported having more frequent discussions with diverse others and more frequent student-faculty interaction. Below are comparisons on items under these two Engagement Indicators.
1a. Discussions with Diverse Others
NSSE question: During the current school year, about how often have you had discussions with people from the following groups? (Rating Scale: Never (1)—Sometimes (2)—Often (3)—Very often (4))

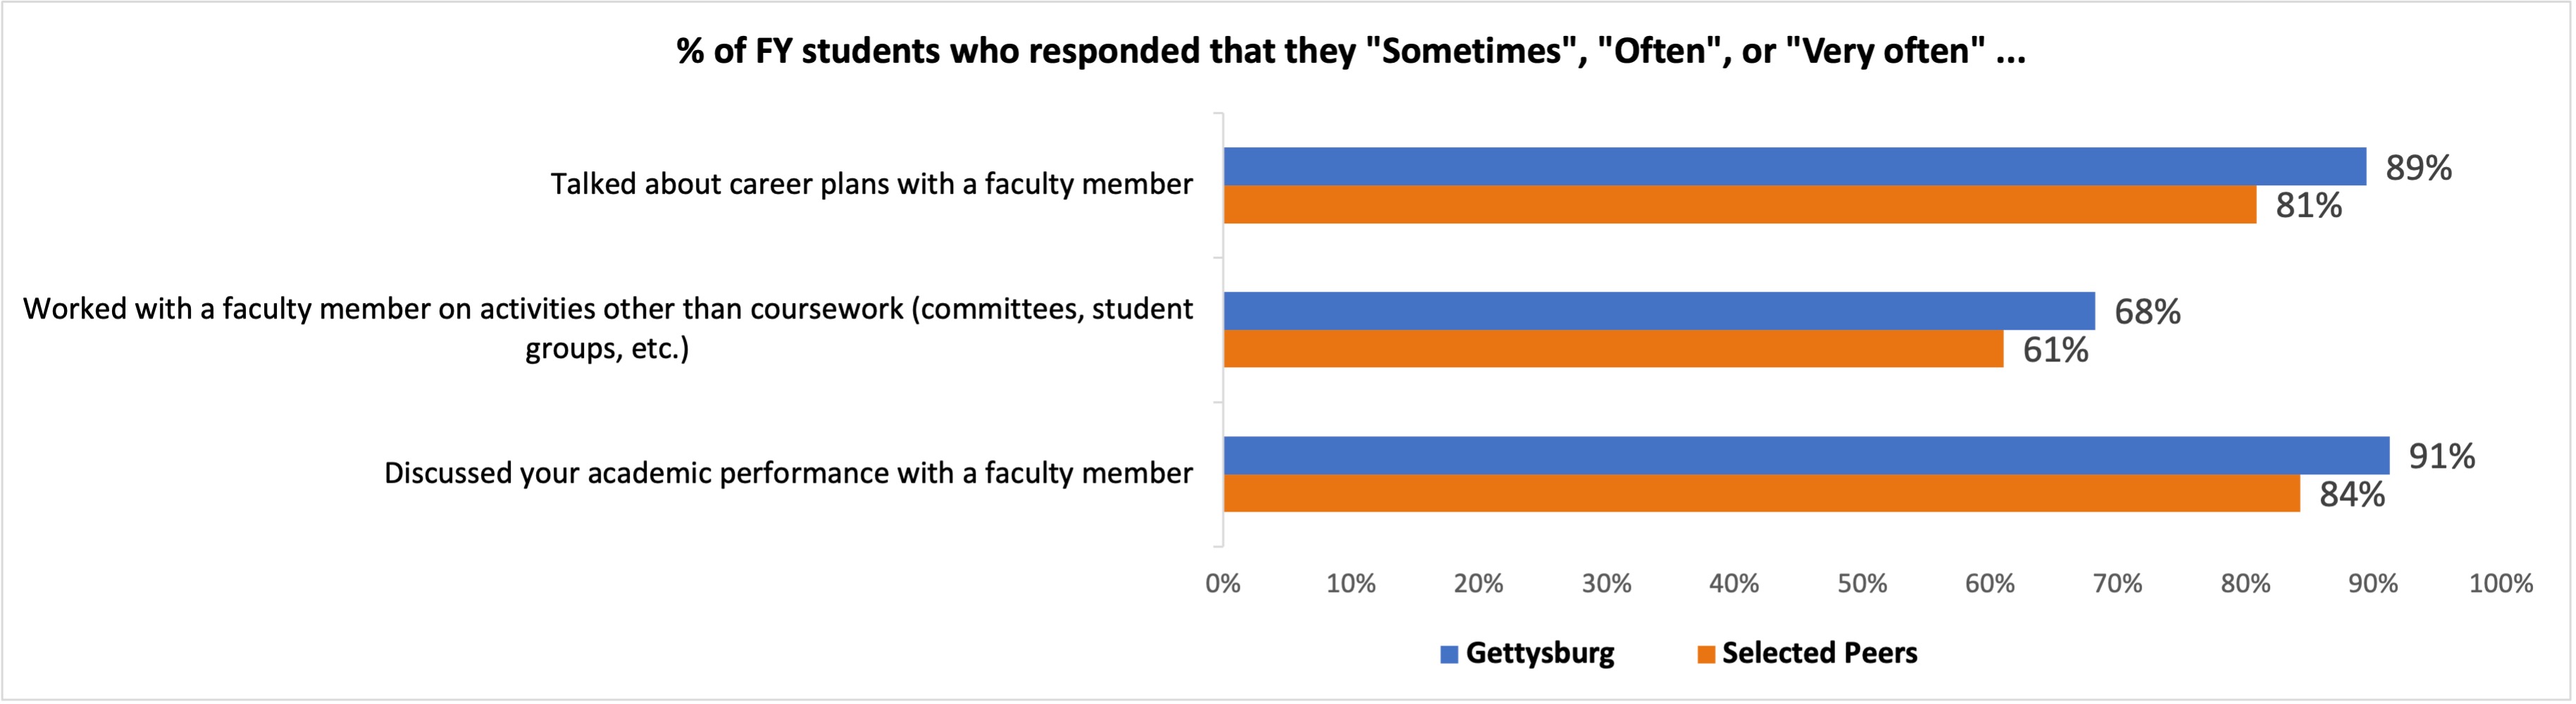
1b. Student-Faculty Interaction
NSSE question: During the current school year, about how often have you done the following? (Rating Scale: Never (1)—Sometimes (2)—Often (3)—Very often (4))
1c. Supportive Environment
Although no statistically significant mean difference was found between Gettysburg and Selected Peers on the overall score of the Engagement Indicator: Supportive Environment, Gettysburg FY students outperformed Selected Peers on three single items.
NSSE question: How much does your institution emphasize the following? (Rating Scale: Very little (1)—Some (2)—Quite a bit (3)—Very much (4))

2. Engagement Indicators: Comparisons with High-Performing Institutions—Top 10% Institutions and Top 50% Institutions
Gettysburg FY students' average score was at least comparable to that of the Top 10% Institutions on three Engagement Indicators:
- Higher-Order Learning (e.g., coursework emphasizing applying facts, theories, or methods to practical problems or new situations)
- Reflective and Integrative Learning (e.g., by frequently examining the strengths and weaknesses of their own views on a topic or issue)
- Discussions with Diverse Others (e.g., people from an economic background other than their own)
Gettysburg FY students' average score was at least comparable to that of the Top 50% Institutions on all the 10 Engagement Indicators.
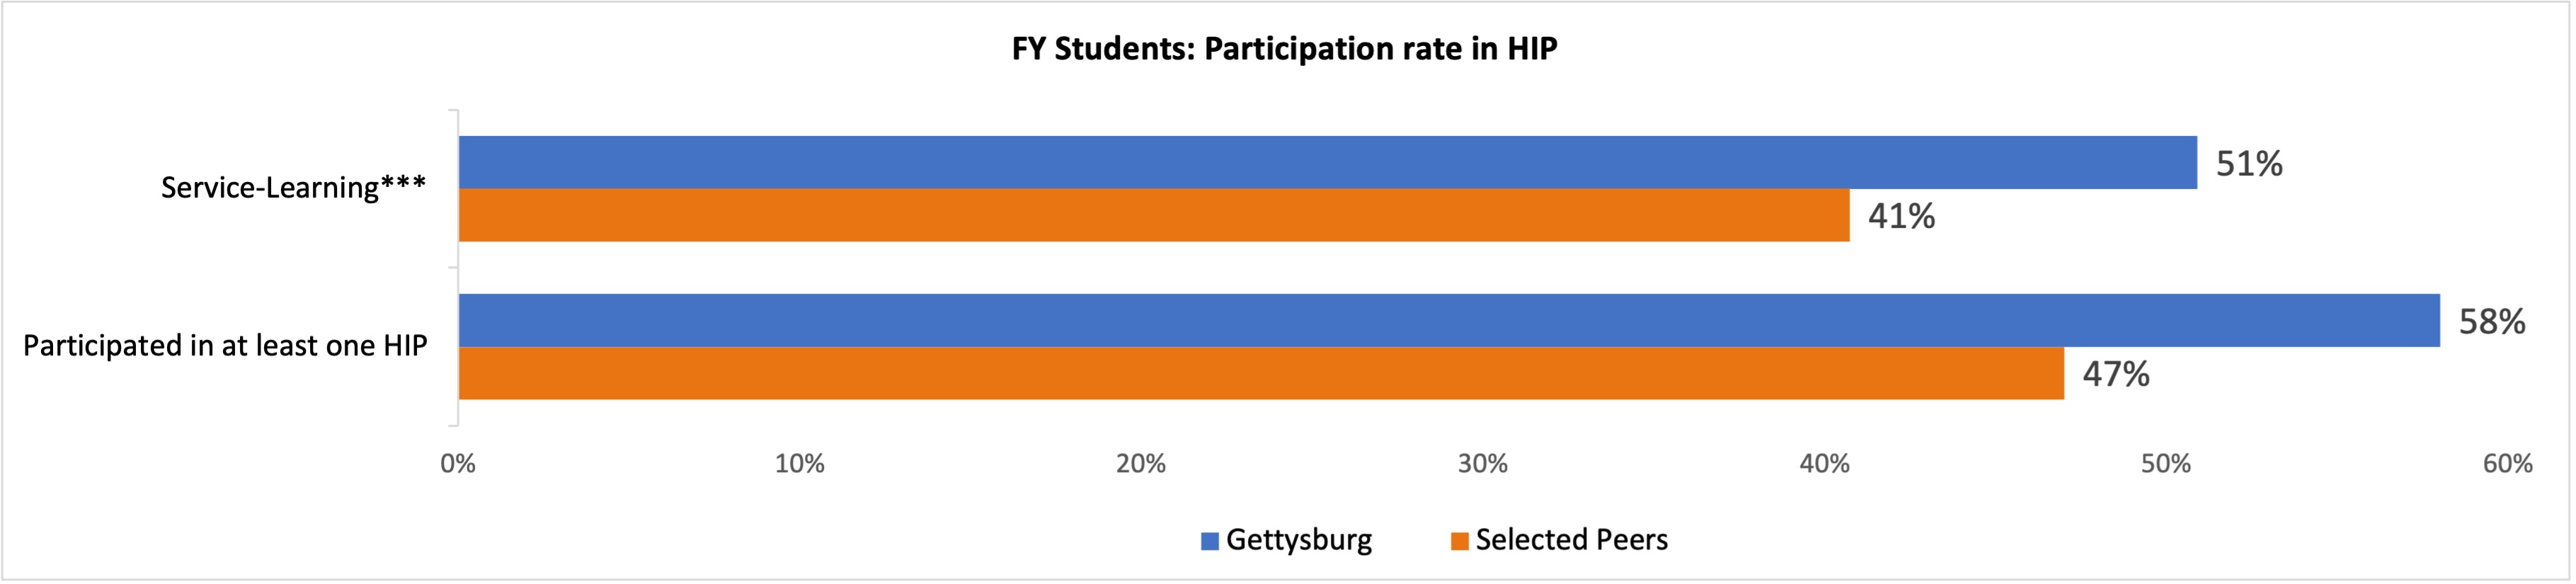
3. Participation in High-Impact Practices (HIPs)
Compared with Selected Peers: A higher percentage of Gettysburg FY students reported they had participated or were participating in...
- service learning***
- at least one HIP (Service-Learning; Learning Community; Research with Faculty)
4. Other Findings
The following survey items were not used by NSSE staff researchers in constructing any of the 10 Engagement Indicators.
Compared with Selected Peers: Gettysburg FY students reported
- higher frequency of having given a course presentation
- having written or were writing more mid-length (between 6 and 10 pages) and long (11 pages or more) papers or reports as part of their assignments
- spending more time per week on working for pay on campus
- spending less time per week relaxing and socializing (time with friends, video games, TV or videos, keeping up with friends online, etc.)
- higher coursework emphasis on memorizing course material
Note:
- *Selected Peers: Beloit, Bucknell, Colby, Colgate, College of the Holy Cross, Denison, Dickinson, Furman, Hamilton, Juniata, Kenyon, Macalester, Muhlenberg, The Univ. of the South, Washington and Lee, Wheaton, Whitman.
- **Top 10% Institutions: institutions with average scores placing them in the top 10% of all 2022 and 2023 NSSE institutions. Top 50% Institutions: institutions with average scores placing them in the top 50% of all 2022 and 2023 NSSE institutions.
- ***Service-Learning: Percentage who responded that at least "Some" courses included a community-based project. Survey question: “About how many of your courses at this institution have included a community-based project (service-learning)?” (Rating scale: None—Some—Most—All).
More info about NSSE can be found here: https://nsse.indiana.edu/nsse/survey-instruments/index.html