The National Survey of Student Engagement (NSSE) collects information about first-year (FY) and senior students' academic experiences and participation in educationally purposeful activities. From Feb. 24, 2020 to mostly end of March 2020, Gettysburg students (Fall 2019 entering cohort) and seniors took the NSSE; Gettysburg FY response rate was 32%; senior response rate, 29%; both exceeded the national average response rate. The survey administration at Gettysburg was somewhat disrupted by the COVID-19 pandemic. NSSE results indicated areas of distinction for Gettysburg in terms of student engagement and outcomes. Below are some highlights based on senior results (Gettysburg seniors' responses were compared with those of seniors in the Carnegie Class* or seniors in High-Preforming Institutions).
Academic challenge
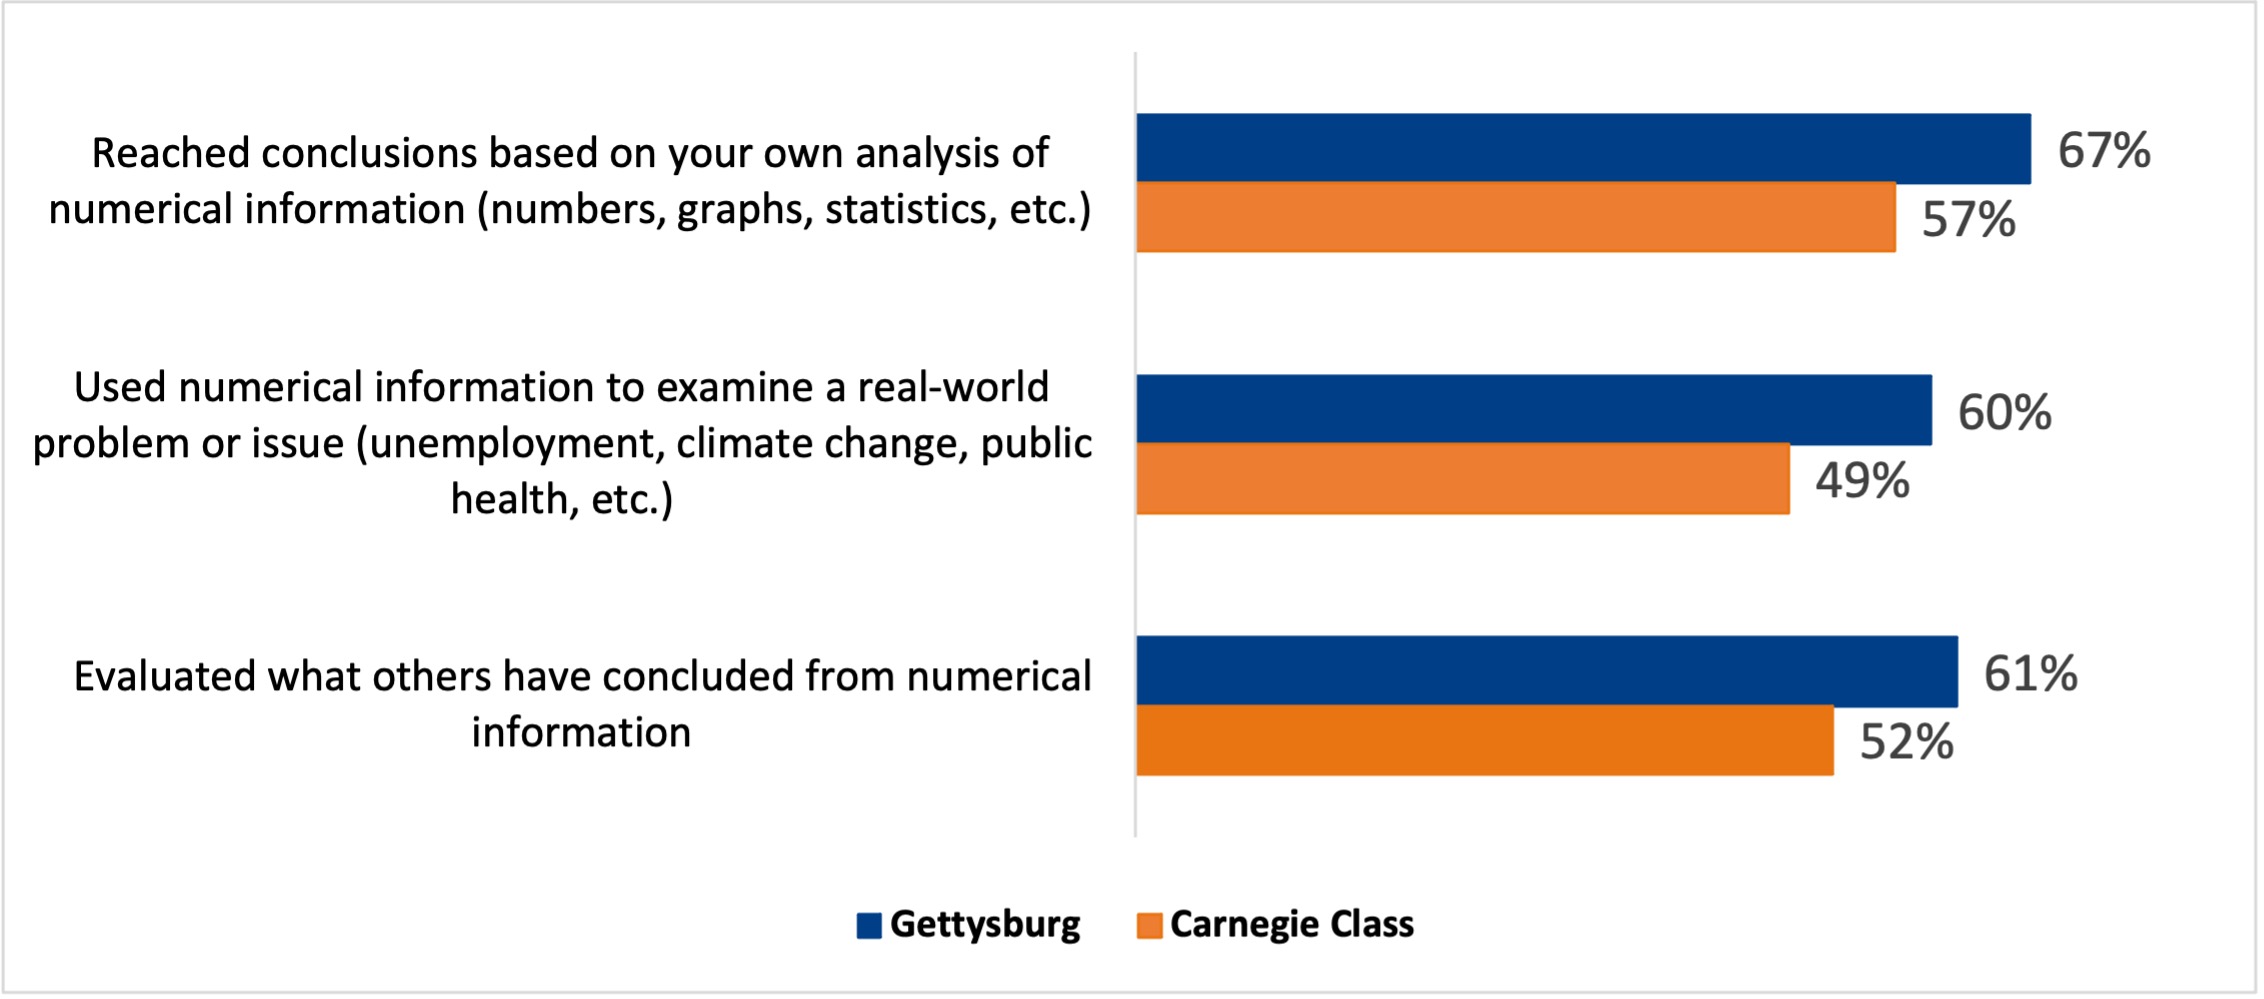
Compared with Carnegie Class (Mean = 31.8): Gettysburg seniors' average score (Mean = 35.6) was significantly higher on one of the Engagement Indicators: Quantitative Reasoning. The chart below shows the percentage of seniors reporting they had frequently ("Often" or "Very often") done the following during their current school year (2019-20 AY):
Comparisons with High-Performing Institutions
Gettysburg seniors' average score was comparable to that of the Top 10% NSSE institutions on 4 Engagement Indicators: Higher-Order Learning; Reflective and Integrative Learning; Quantitative Reasoning; Effective Teaching Practices.
Learning outcomes
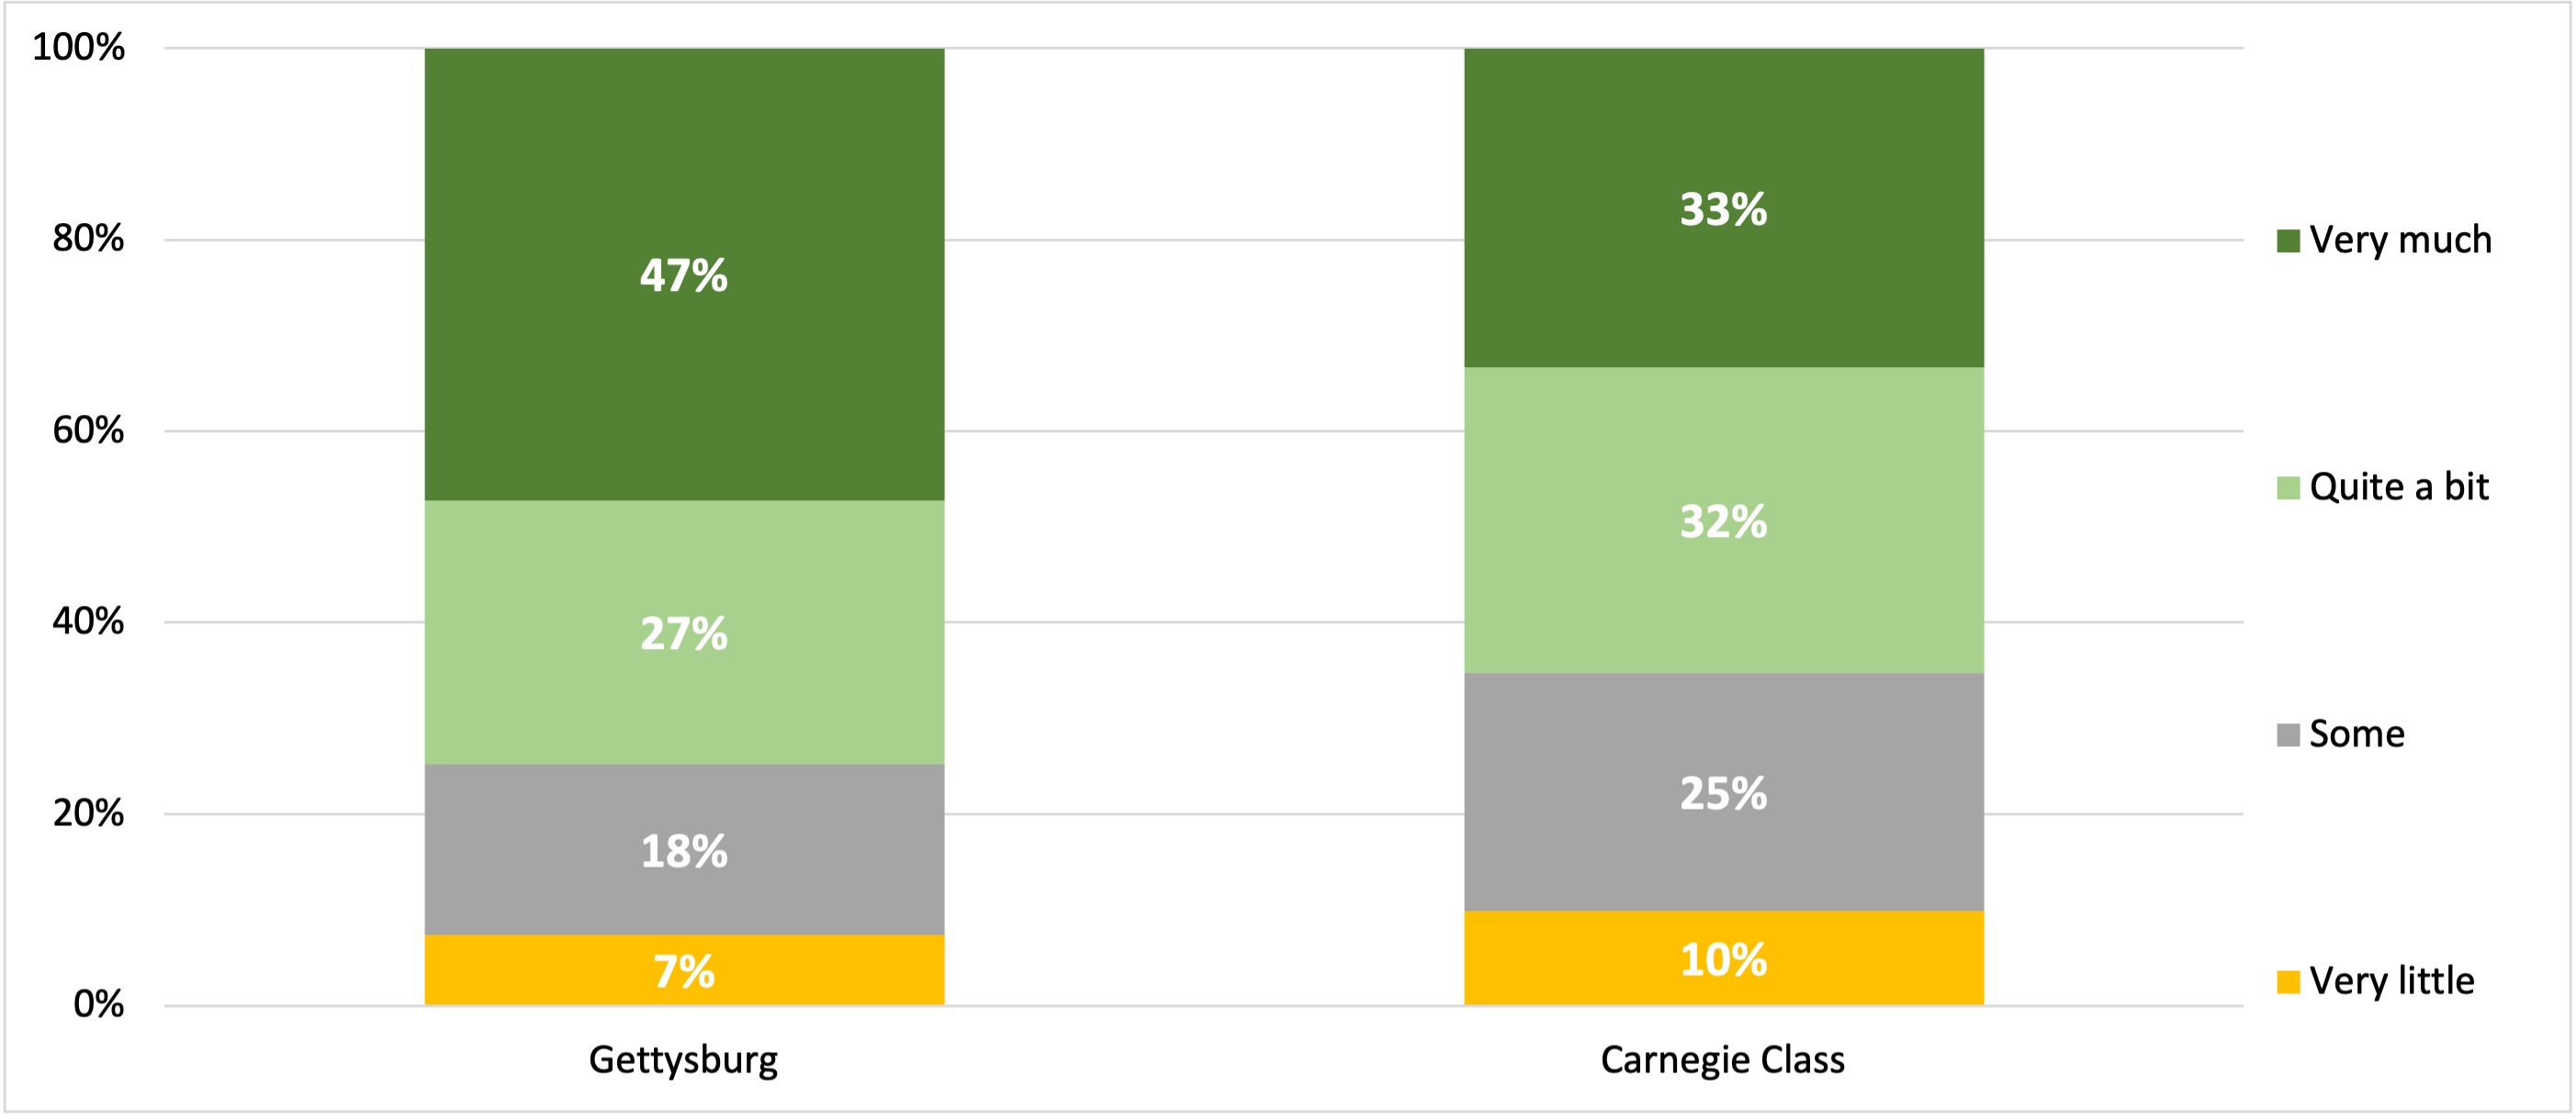
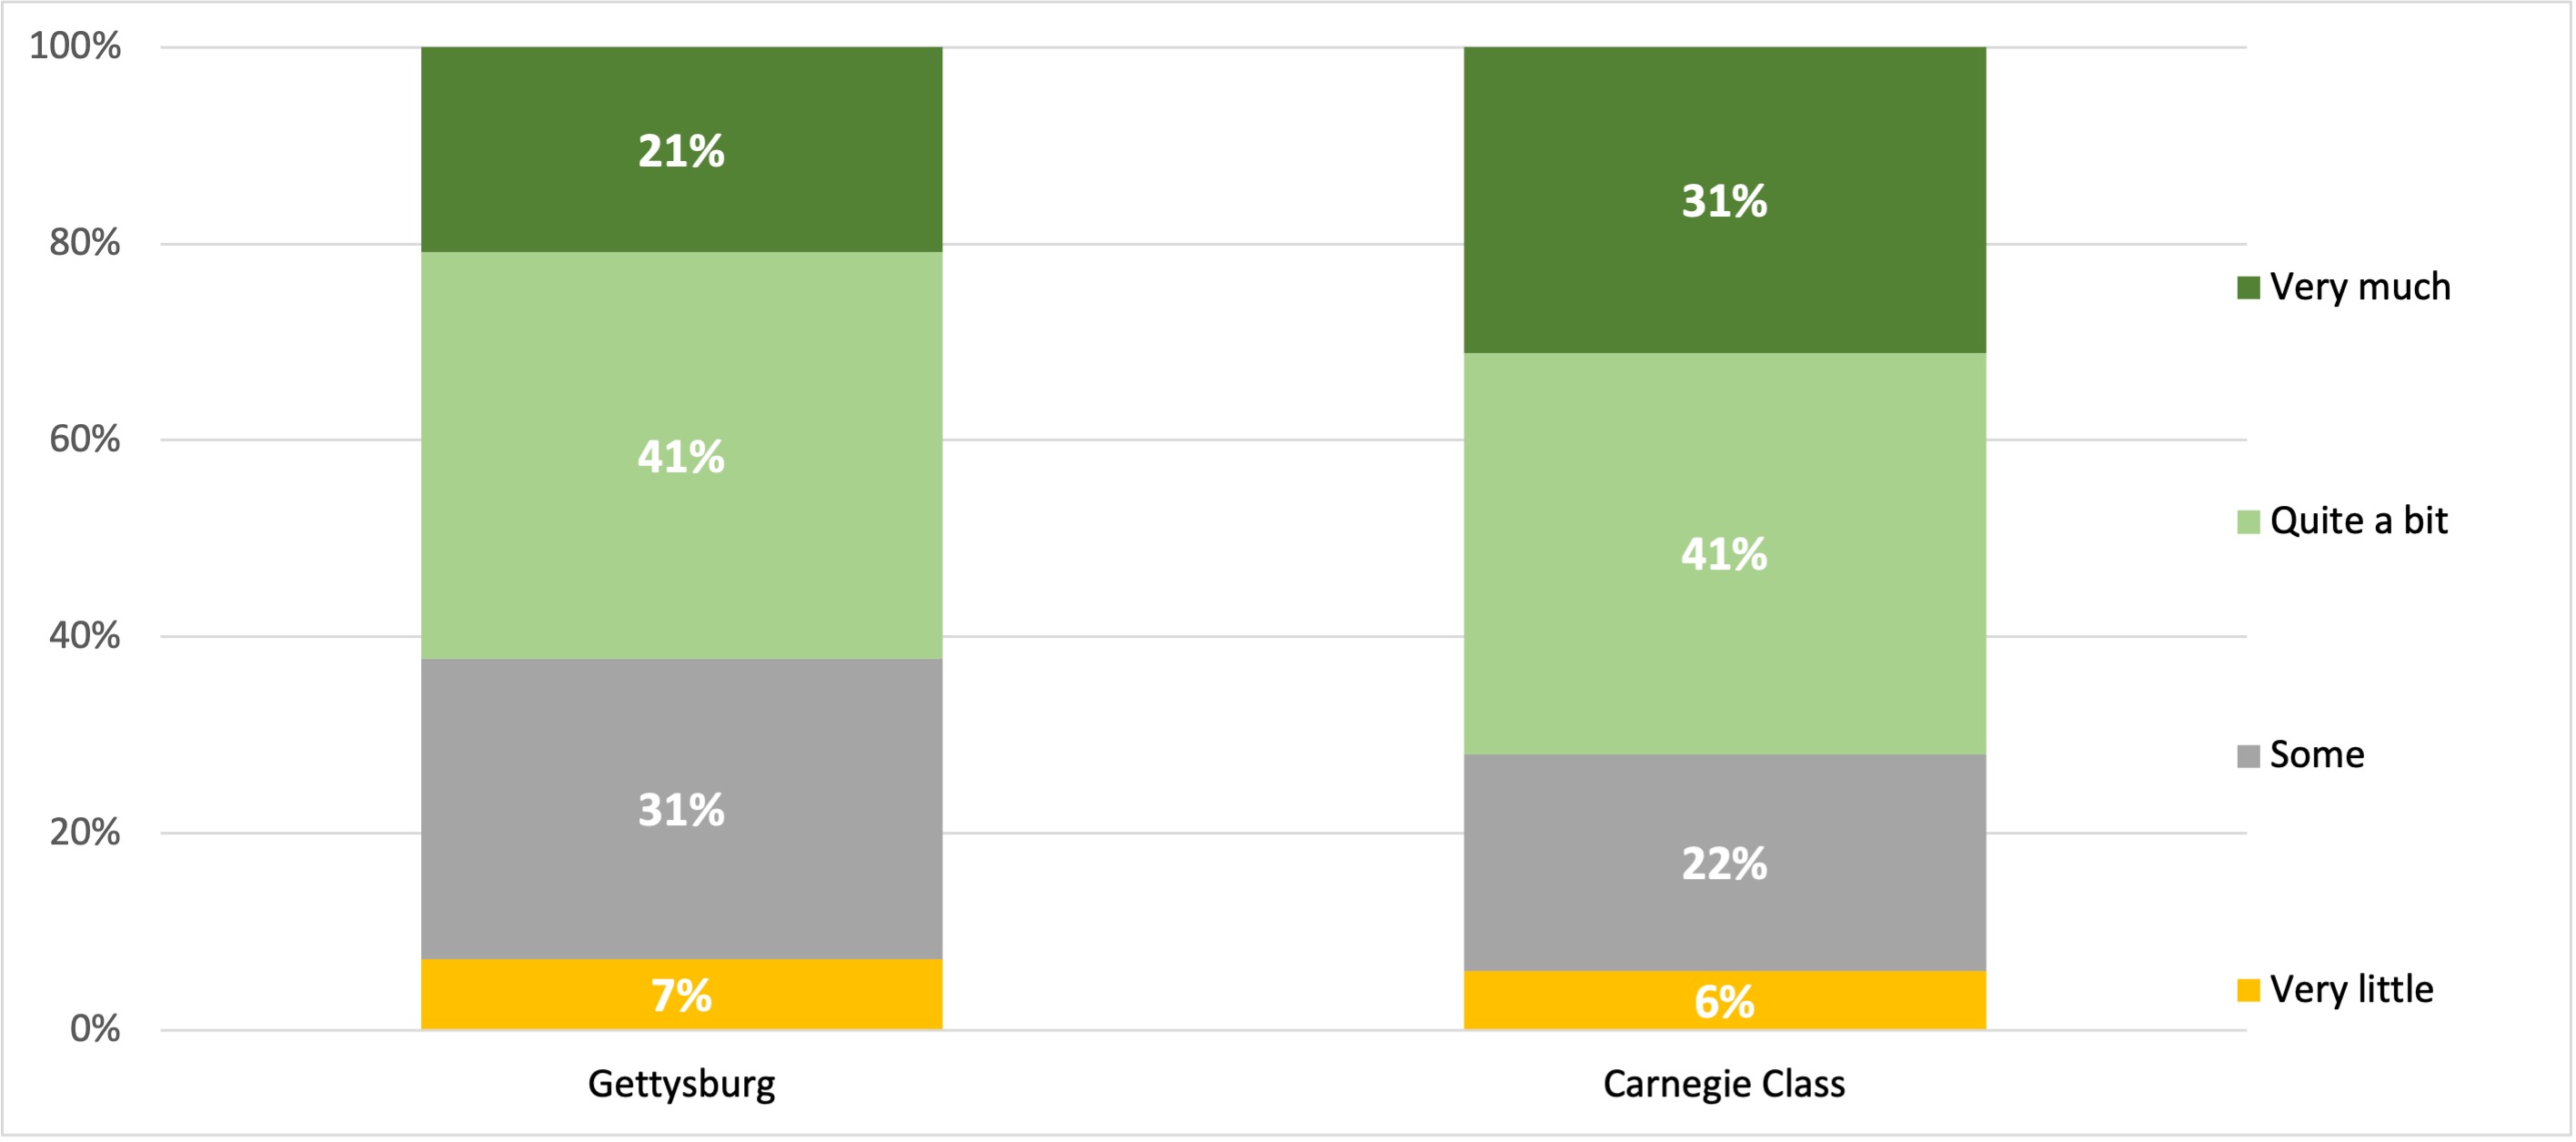
Compared with Carnegie Class (Mean= 2.9), Gettysburg seniors reported significantly more gains (Mean =3.1) in analyzing numerical and statistical information. The chart below displays seniors' responses to the question: "How much has your experience at this institution contributed to your knowledge, skills, and personal development in analyzing numerical and statistical information?"
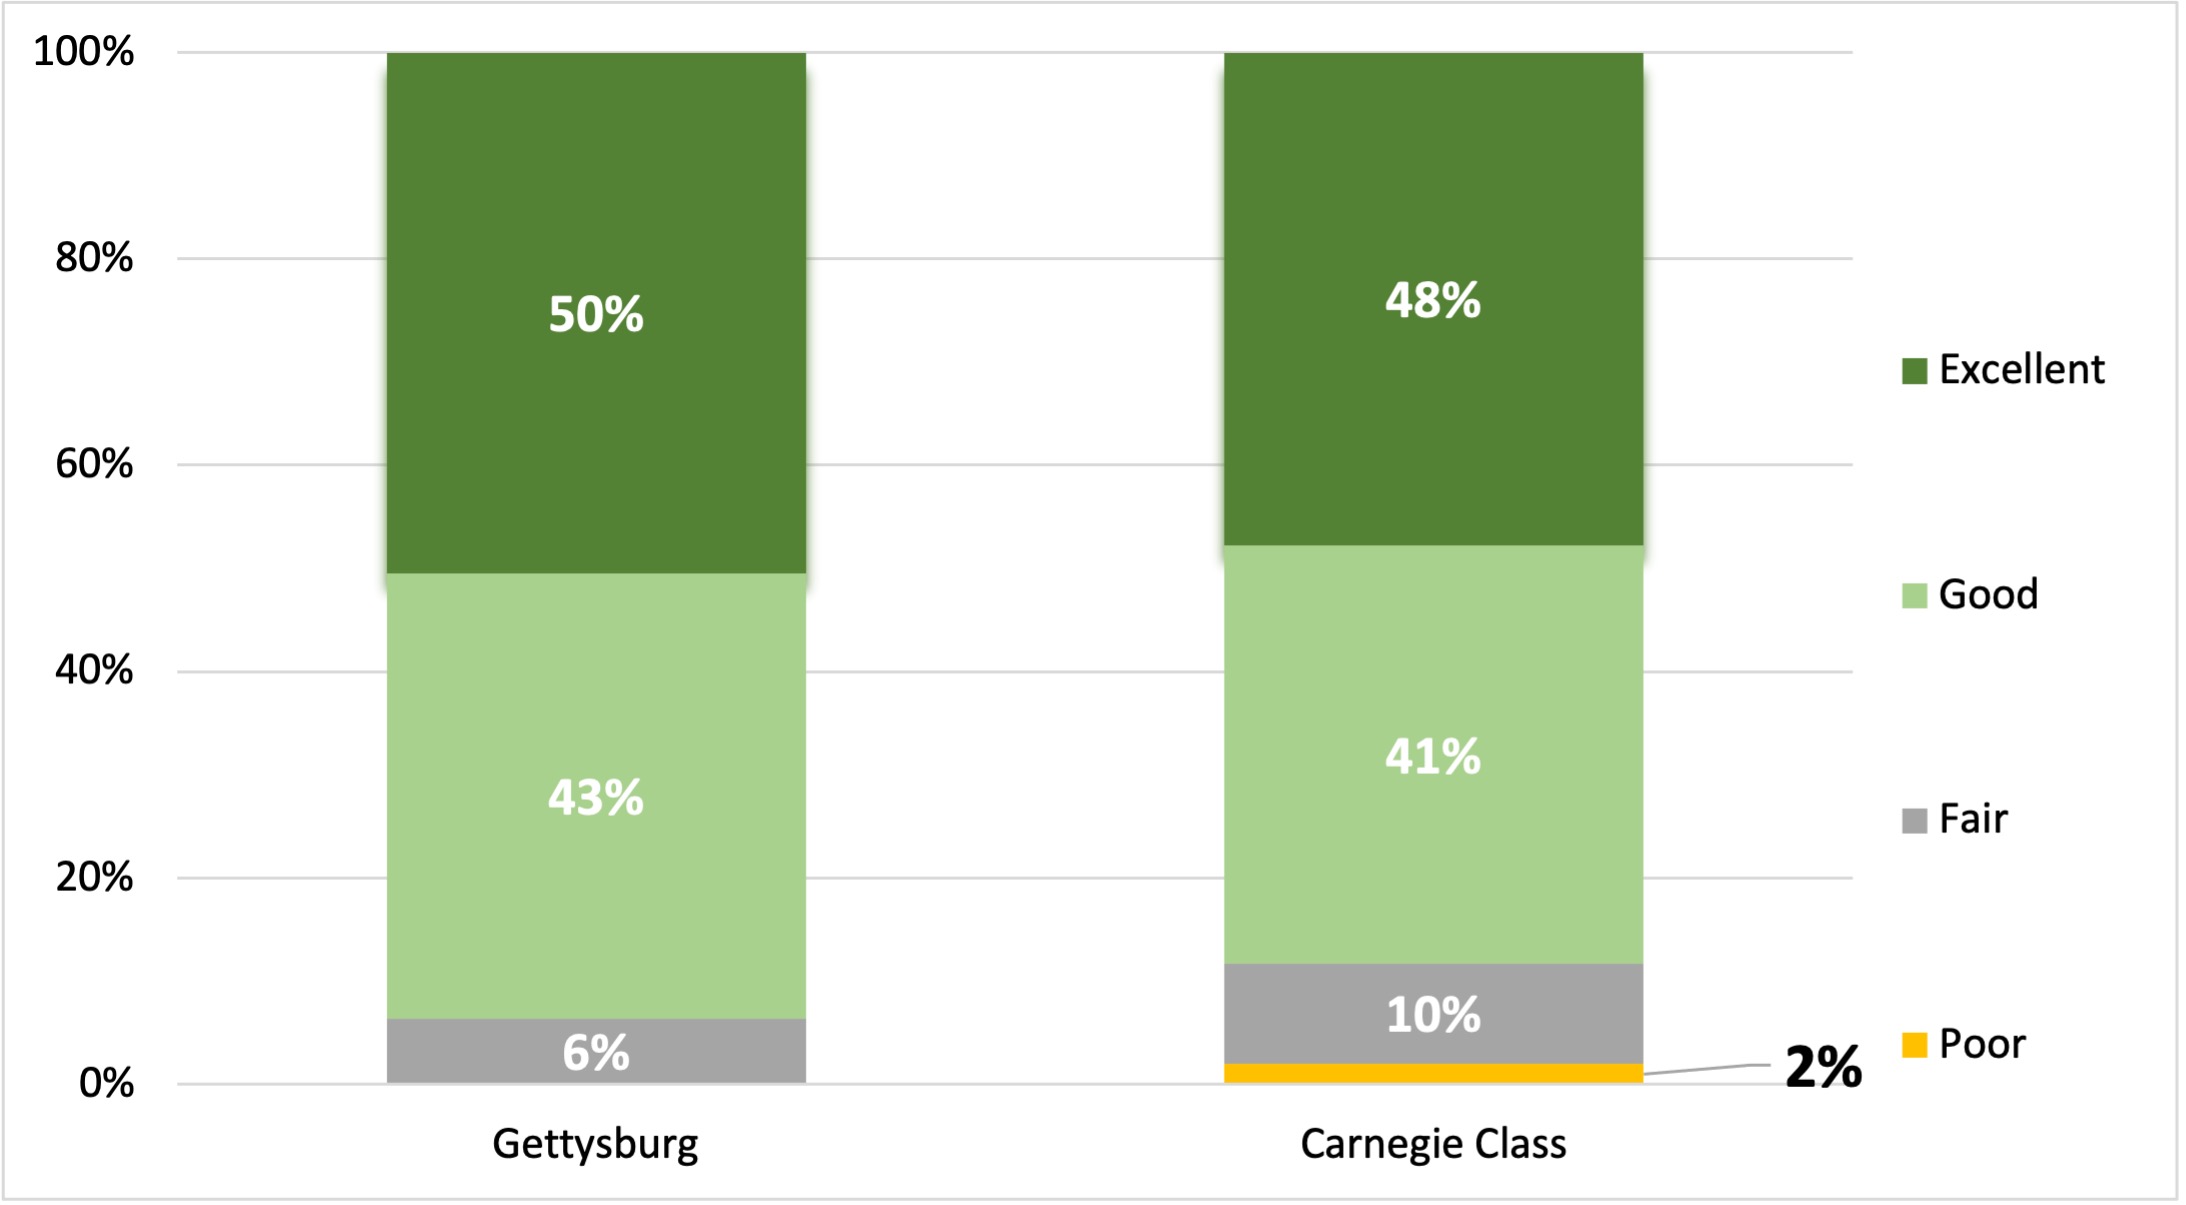
How would you evaluate your entire educational experience at this institution?
On average, Gettysburg senior's evaluation of their entire educational experience at their current institution (Mean = 3.4) was significantly higher than that of Carnegie Class (Mean = 3.3). The chart below displays the responses.
Participation in High-Impact Practices (HIPs)
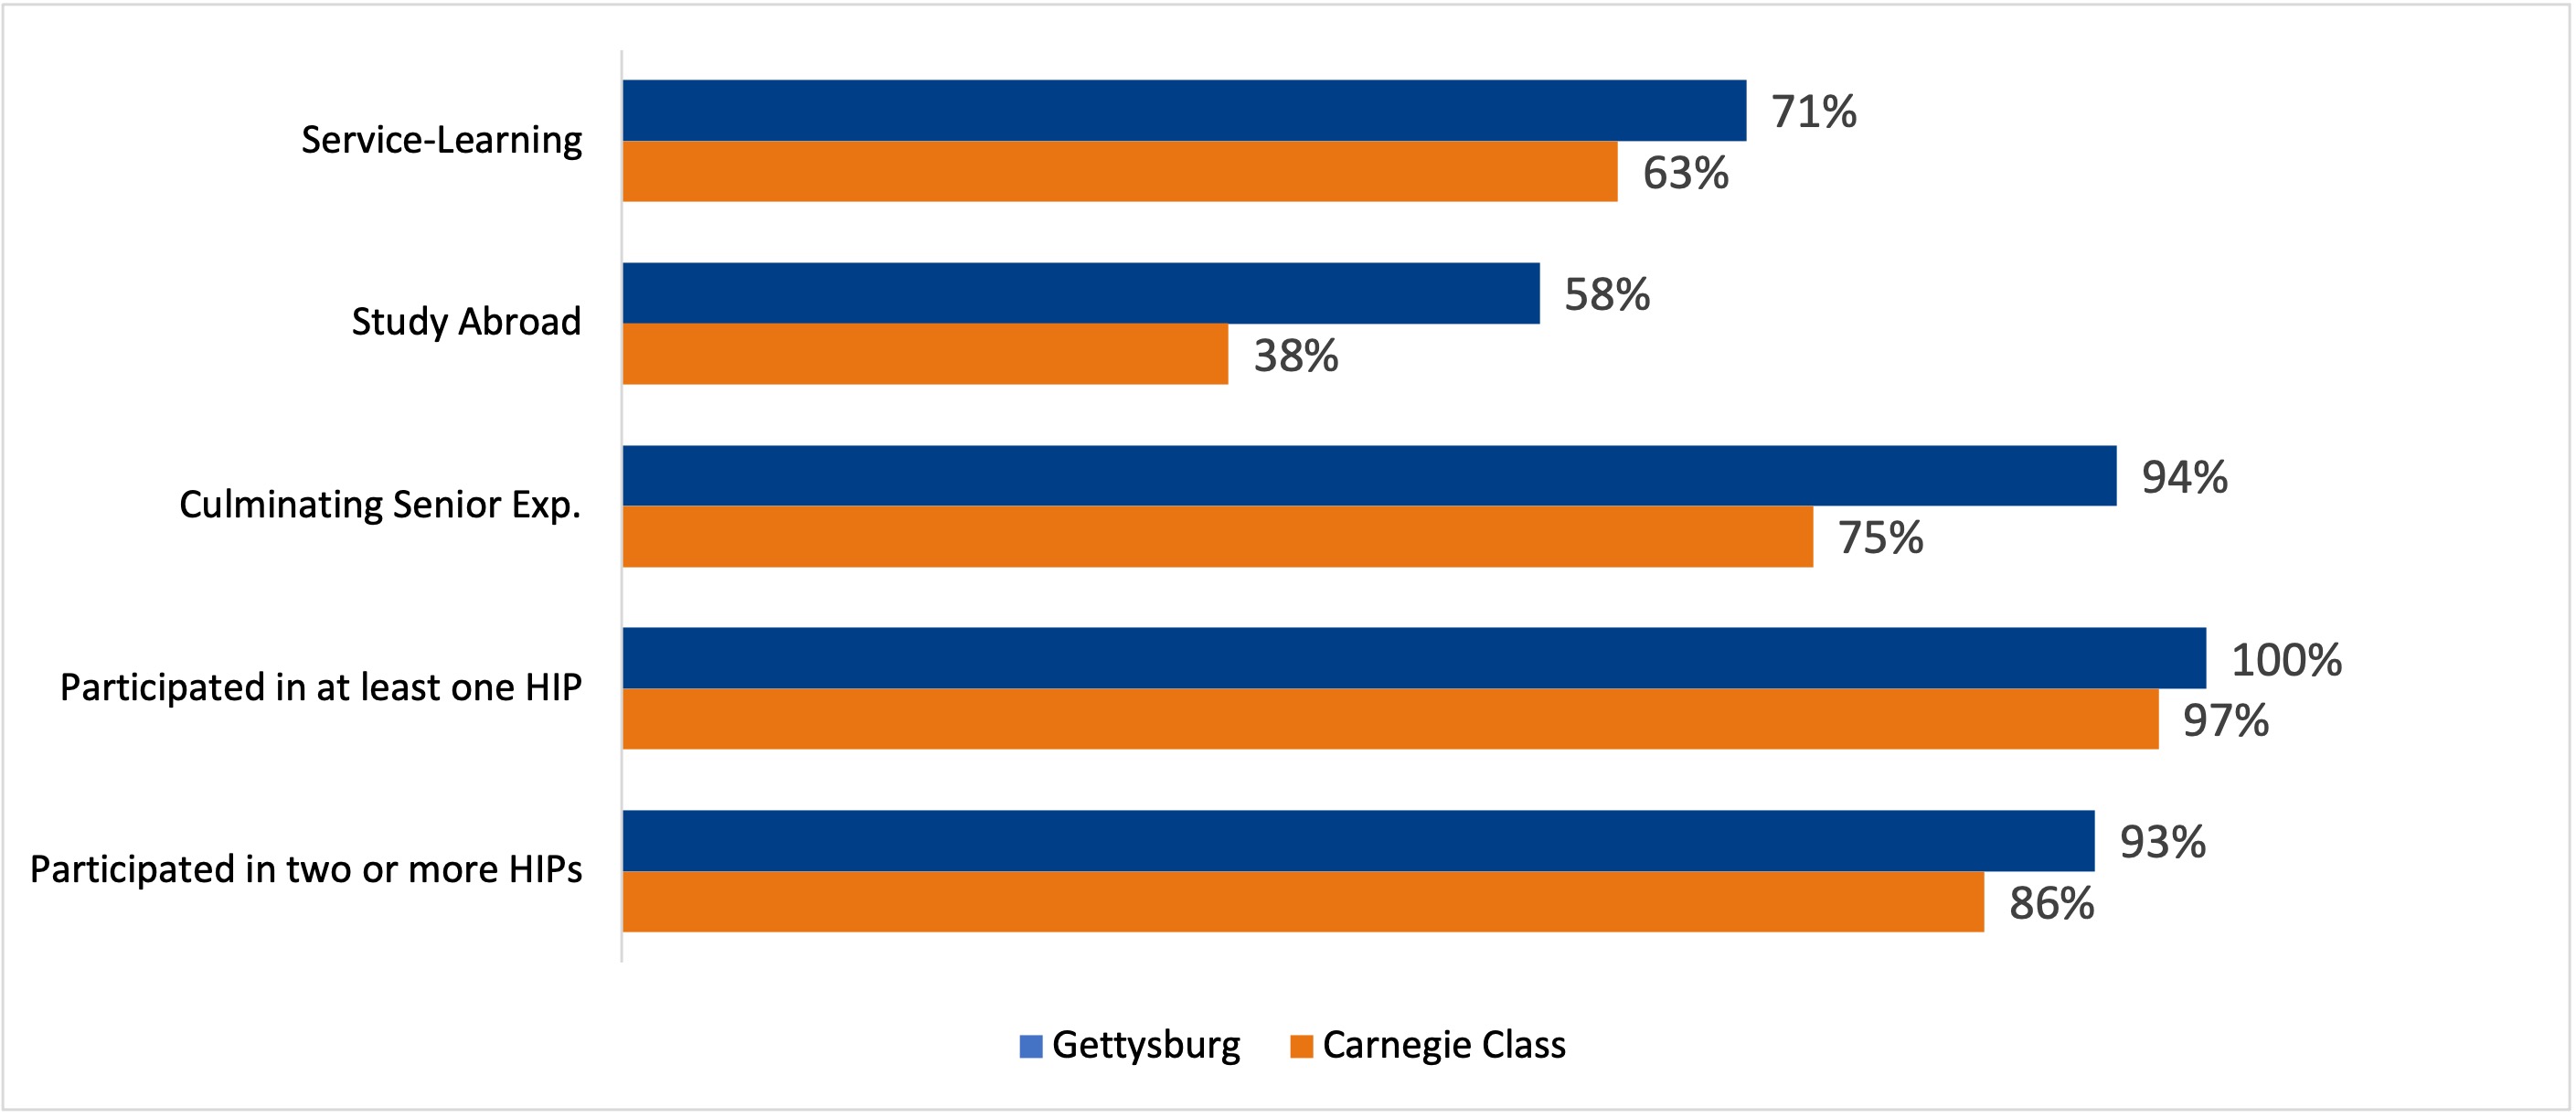
Gettysburg seniors participated in some HIPs at a significantly higher rate. The chart below displays their participation rates and those of seniors in Carnegie Class.
Challenges/Opportunities
NSSE results also suggest a few challenges/areas for improvement. In terms of Campus Environment, compared with Carnegie Class, Gettysburg seniors perceived less institutional emphasis on using learning support services (tutoring services, writing center, etc.) (Gettysburg Mean = 2.8; Carnegie Class Mean = 3.0). Higher emphasis indicates a more supportive environment. The chart below displays seniors' responses to the question: "How much does your institution emphasize the following--Using learning support services? "
Note: Carnegie Class refers to Liberal Arts Colleges.