The Higher Education Data Sharing Consortium (HEDS) Graduating Senior Survey asks graduating seniors to rate their college experience. From April 19, 2021 to May 14, 2021, all Gettysburg May 2021 graduating seniors were invited to take this exit survey. Gettysburg response rate was 80% (Total sample: 441 respondents).
86% of Gettysburg 2021 graduating class reported that overall, they were satisfied with their undergraduate education at this institution (similar to the Peer Group). 2021 Survey results indicate Gettysburg’s many distinctive strengths in comparison with the Peer Group, too numerous to enumerate here; below are examples of statistically significant mean differences between Gettysburg and the Peer Group based on the 2021 survey.
Learning outcomes
The survey asks, “To what extent has your experience at this institution contributed to your knowledge, skills and personal development in the following areas?” A total of 13 specific learning outcomes were listed. Gettysburg seniors’ average scores were significantly higher than those of the Peer Group on 8 learning outcomes (creative thinking; quantitative literacy; effective speaking; teamwork; civic engagement; intercultural knowledge & competence; ethical reasoning; integrative thinking); on the remaining 5 outcomes, Gettysburg was similar to the Peer Group.
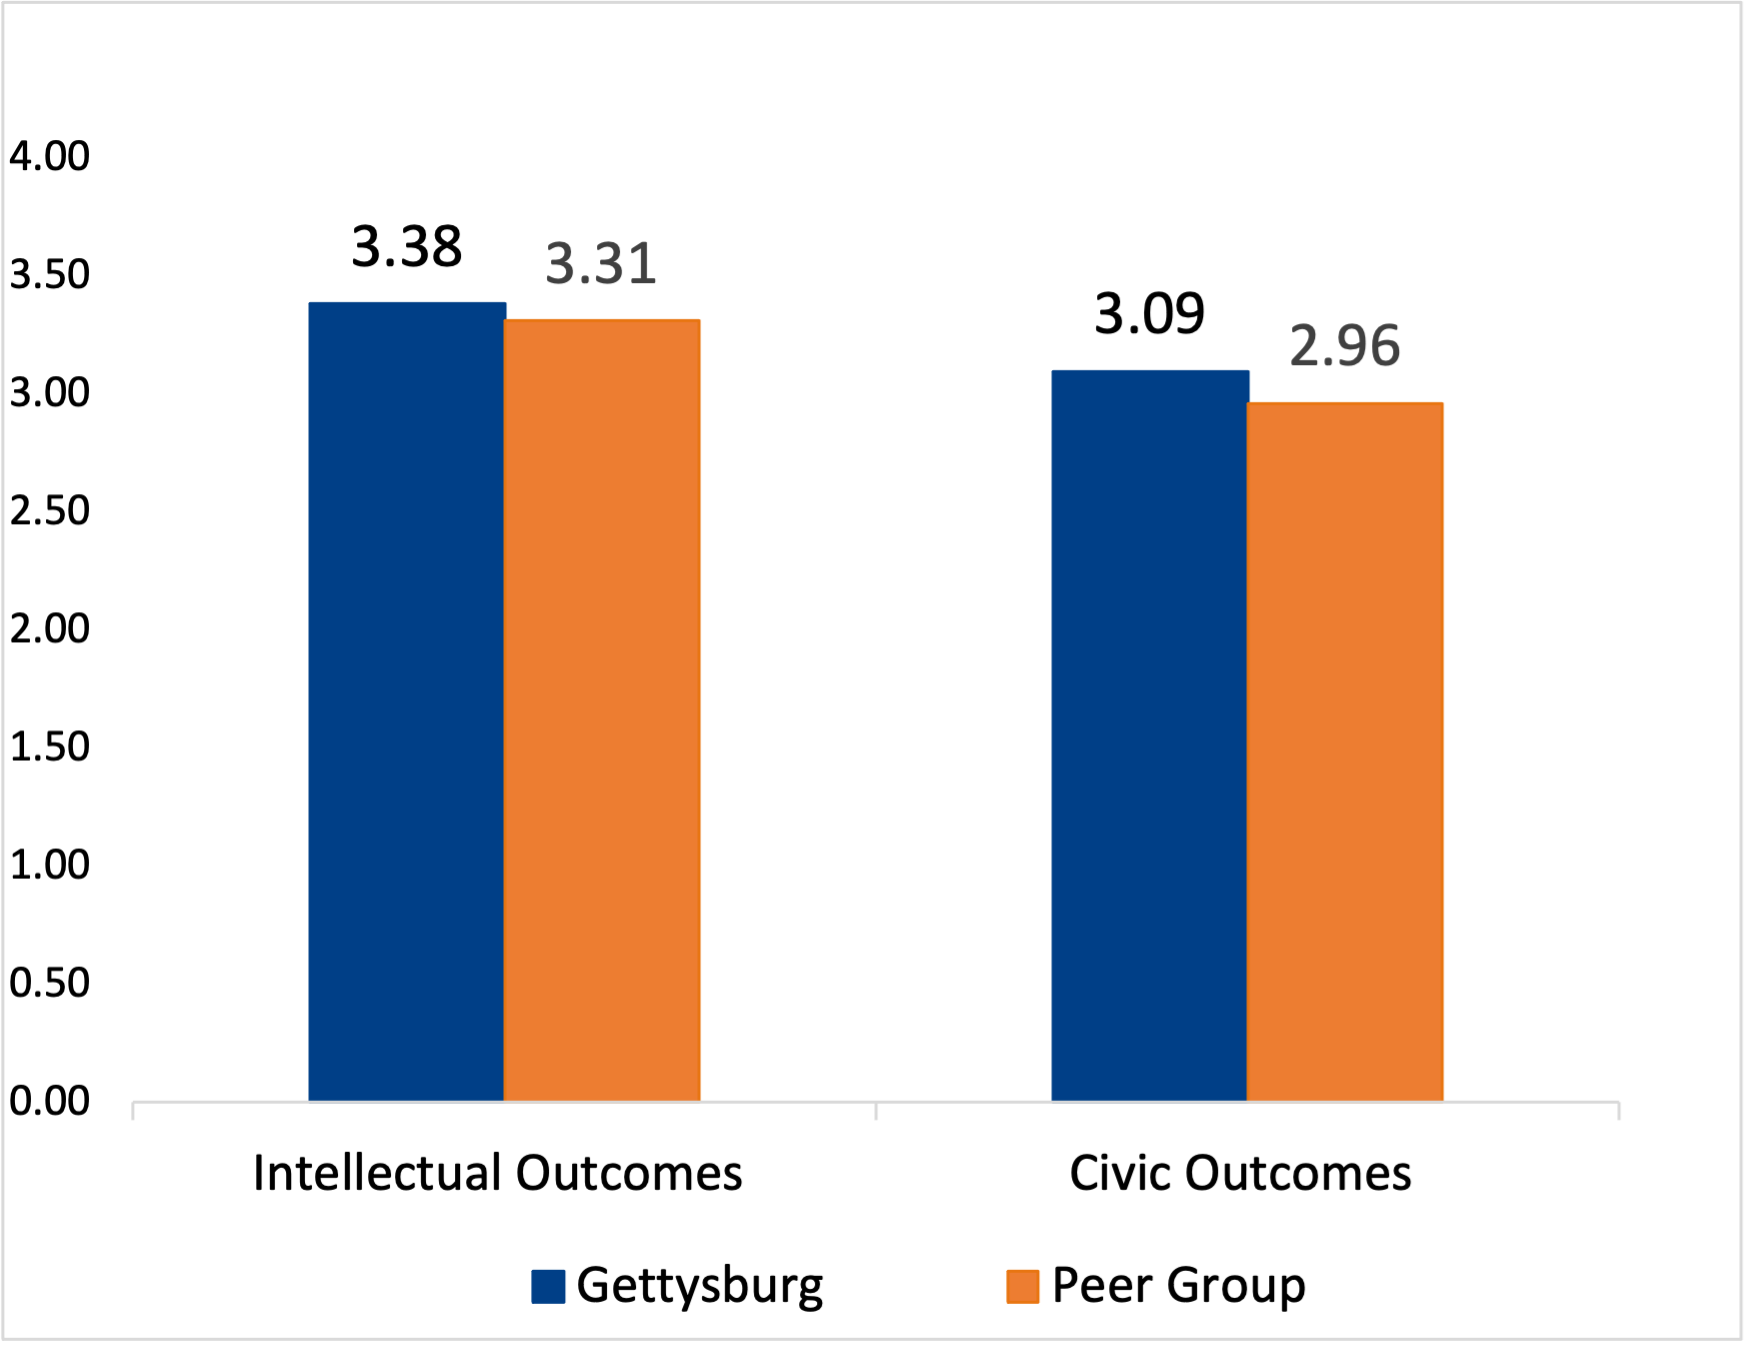
More broadly, Gettysburg’s average scale score for Intellectual Outcomes was significantly higher than that of the Peer Group; this scale score was based on 10 specific learning outcomes—careful reading, critical thinking, creative thinking, information literacy, quantitative literacy, effective writing, effective speaking, teamwork, problem solving, and integrative thinking. Gettysburg's average scale score for Civic Outcomes was also significantly higher than that of the Peer Group; this scale score was based on 3 specific learning outcomes—civic engagement, intercultural knowledge and competence, and ethical reasoning, as well as institutional impact in terms of preparing seniors for post-undergraduate life with regard to social and civic involvement. The chart below displays the average scale score for...
Academic Experiences
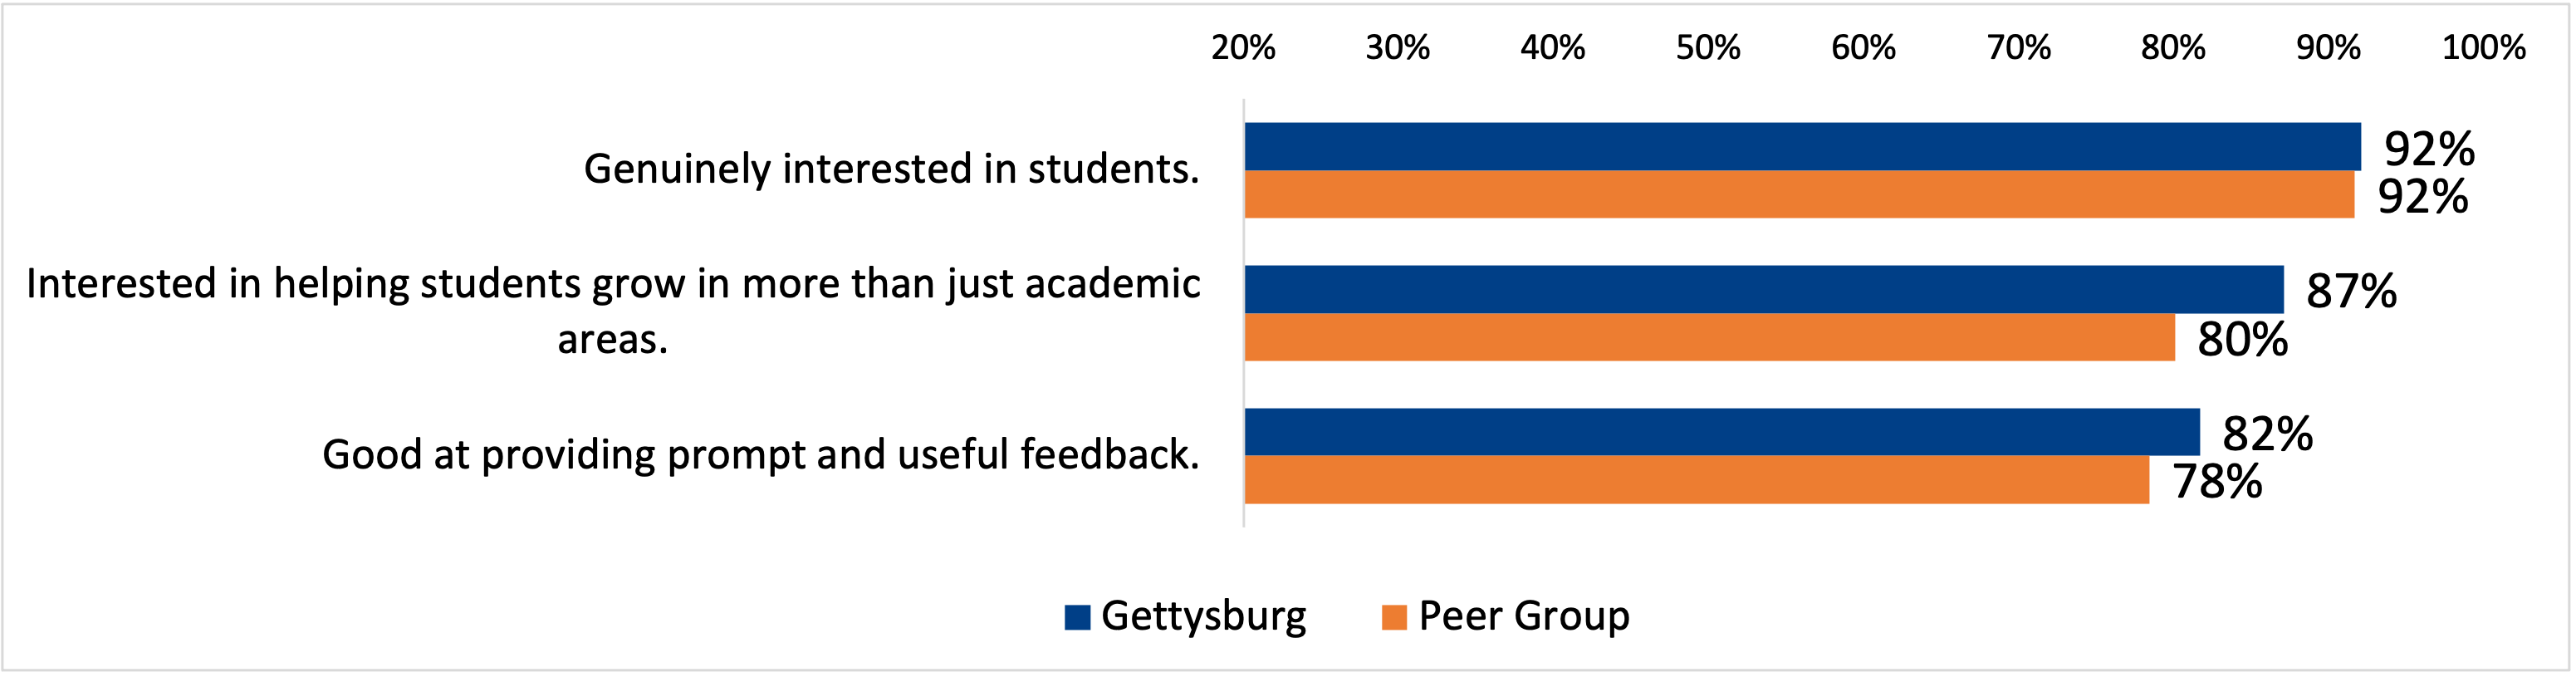
Gettysburg's average score was significantly higher than that of the Peer Group on the following items measuring perceived faculty interest in students. The chart below displays the combined % of seniors who “Agree" or “Strongly agree” that most faculty with whom they had contact at this institution were…
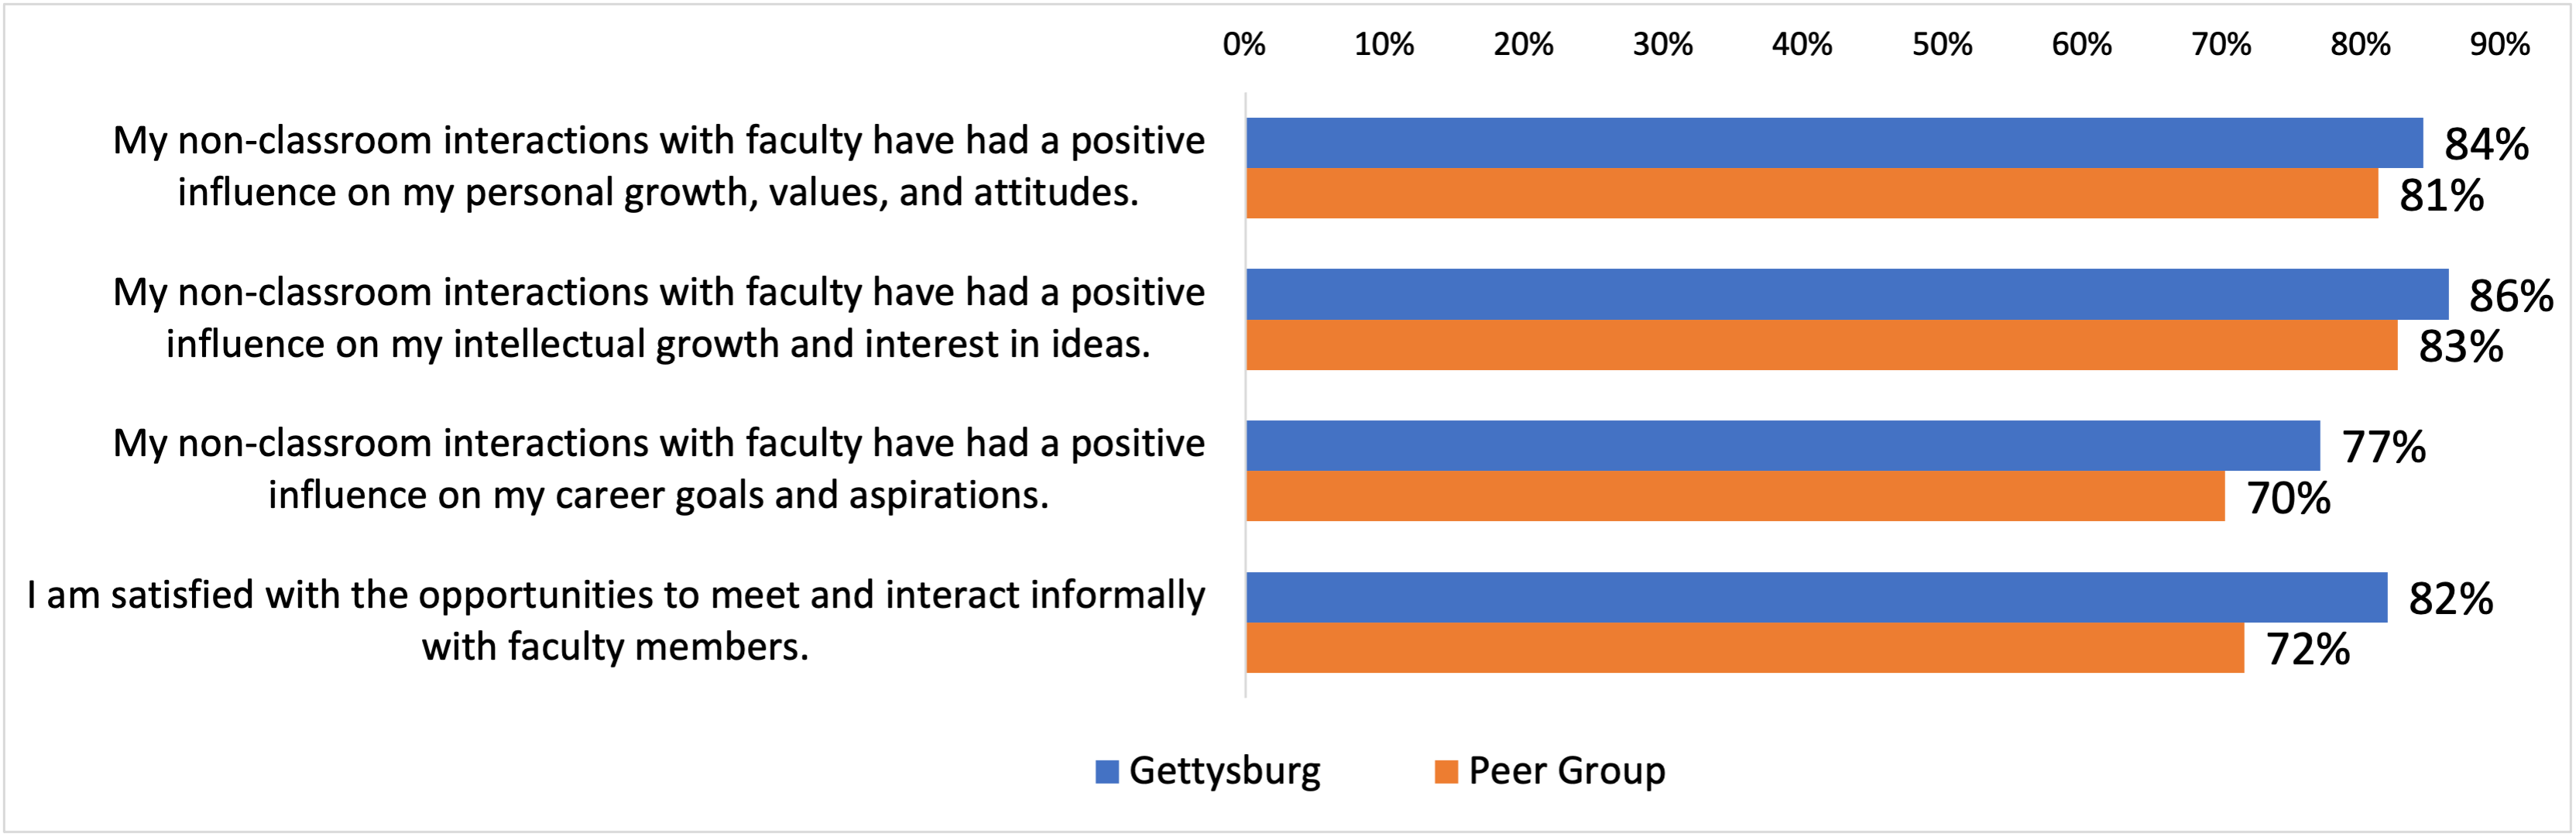
Gettysburg’s average score was significantly higher than that of the Peer Group on the following items measuring perceived quality of interactions with faculty. Overall, Gettysburg seniors reported more impactful interactions with faculty. The chart below displays the combined % of seniors who “Agree" or “Strongly agree” that…
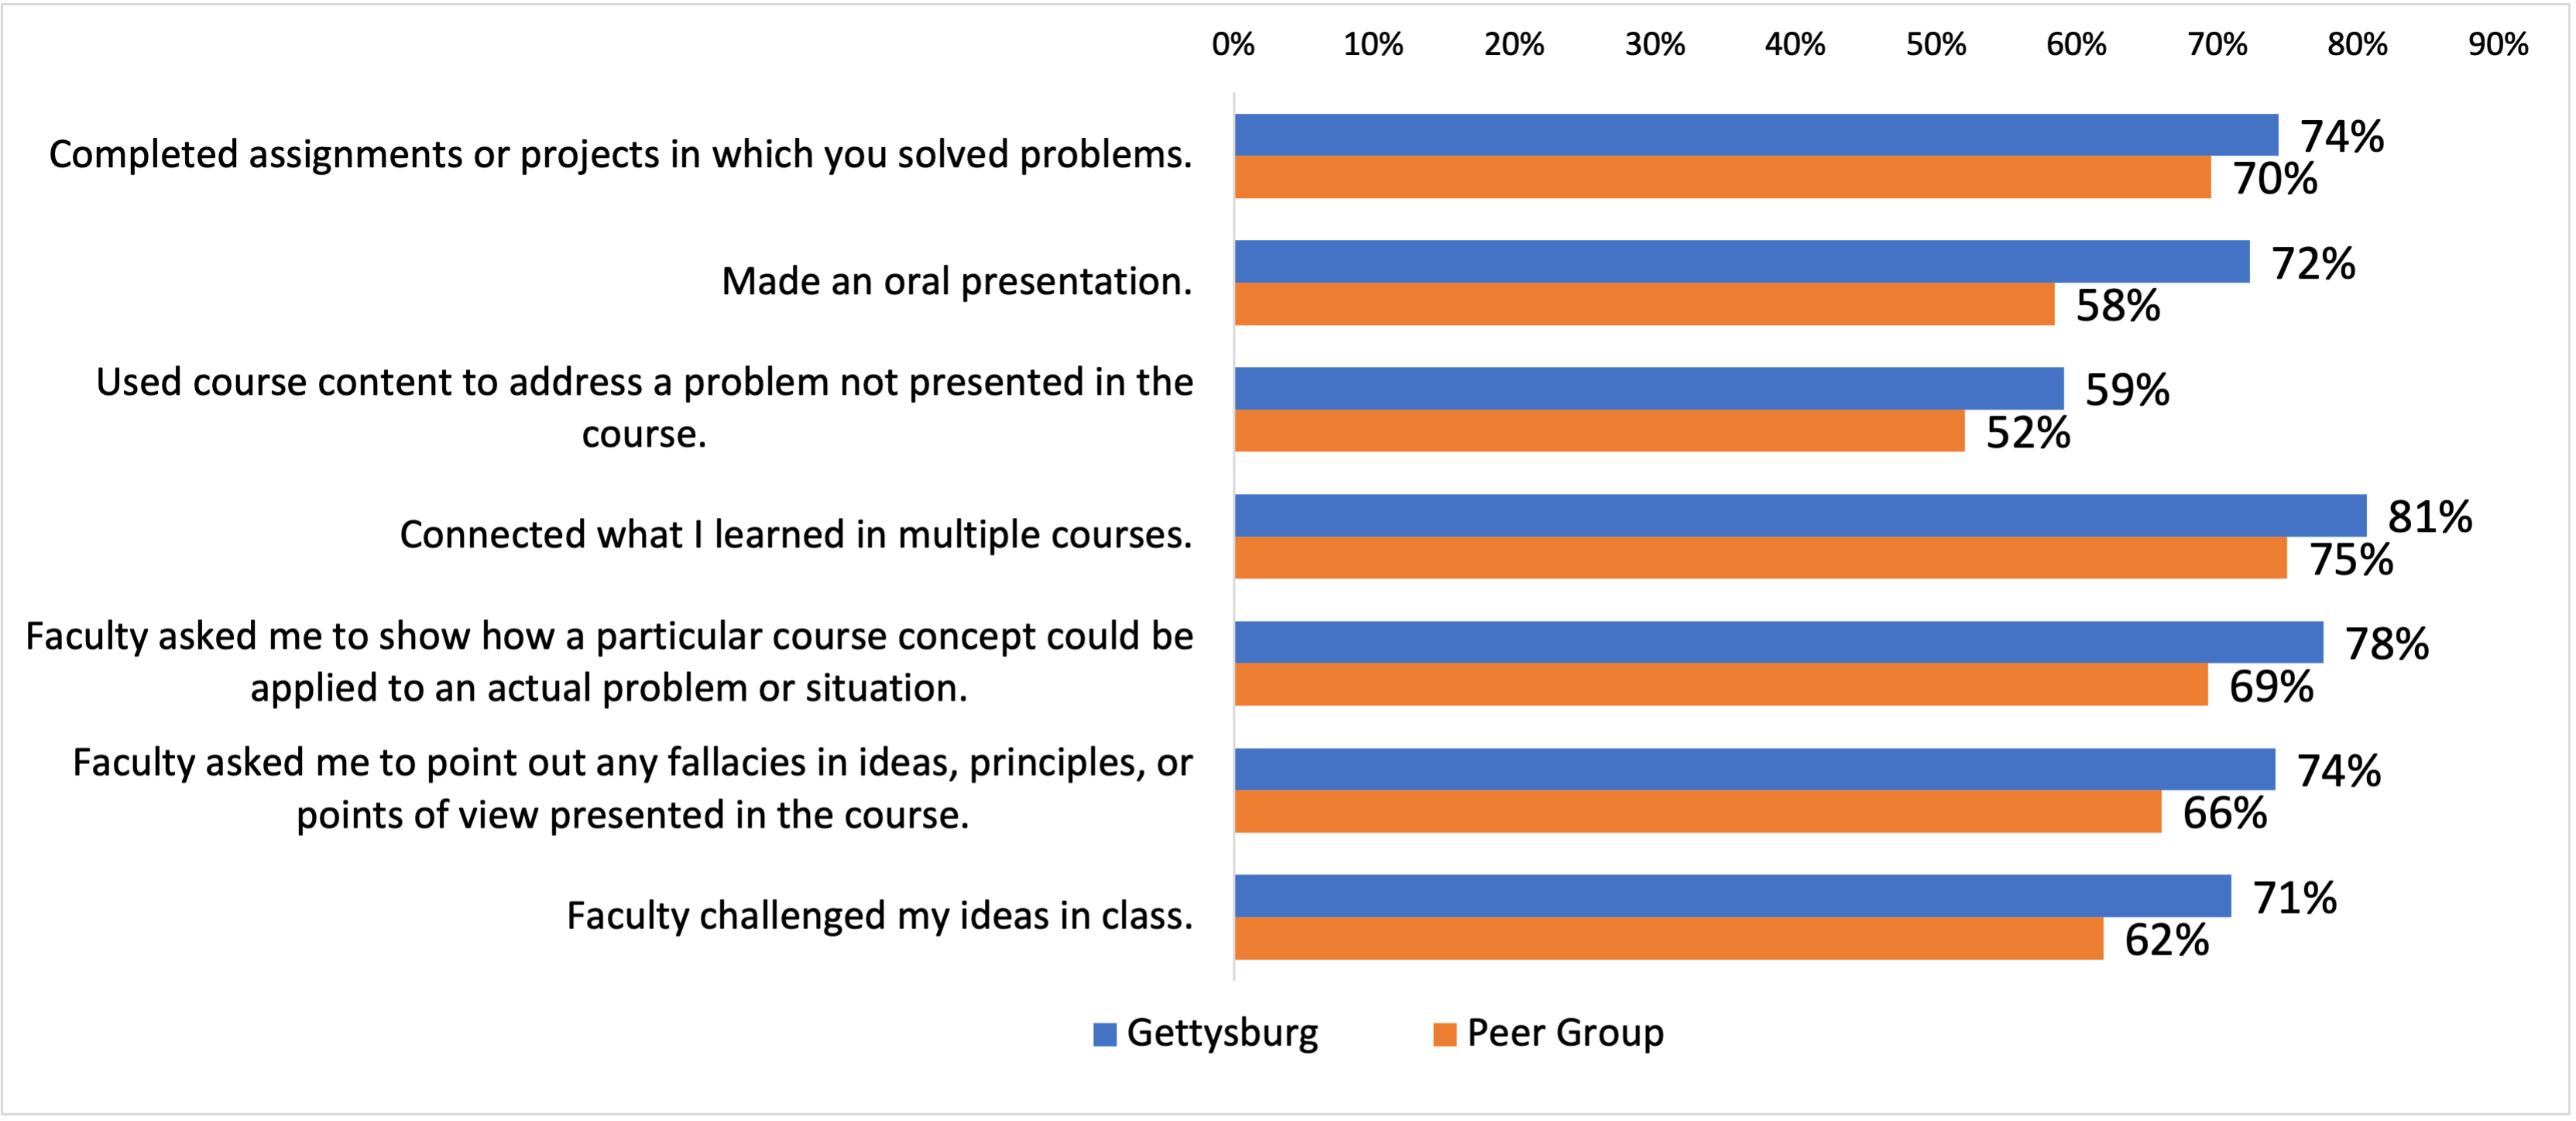
Further, Gettysburg’s average scale score for Levels of Academic Challenge (mean=4.06) was significantly higher than that of the Peer Group (mean=3.96) (based on a 4-point rating scale); this scale score was based on 14 survey items. Overall, Gettysburg seniors reported higher frequencies of completing challenging assignments/exams and higher faculty expectations. Specifically, Gettysburg's average score was significantly higher on the following items; the chart below displays the combined % of seniors reporting they have frequently experienced the following in their classes:
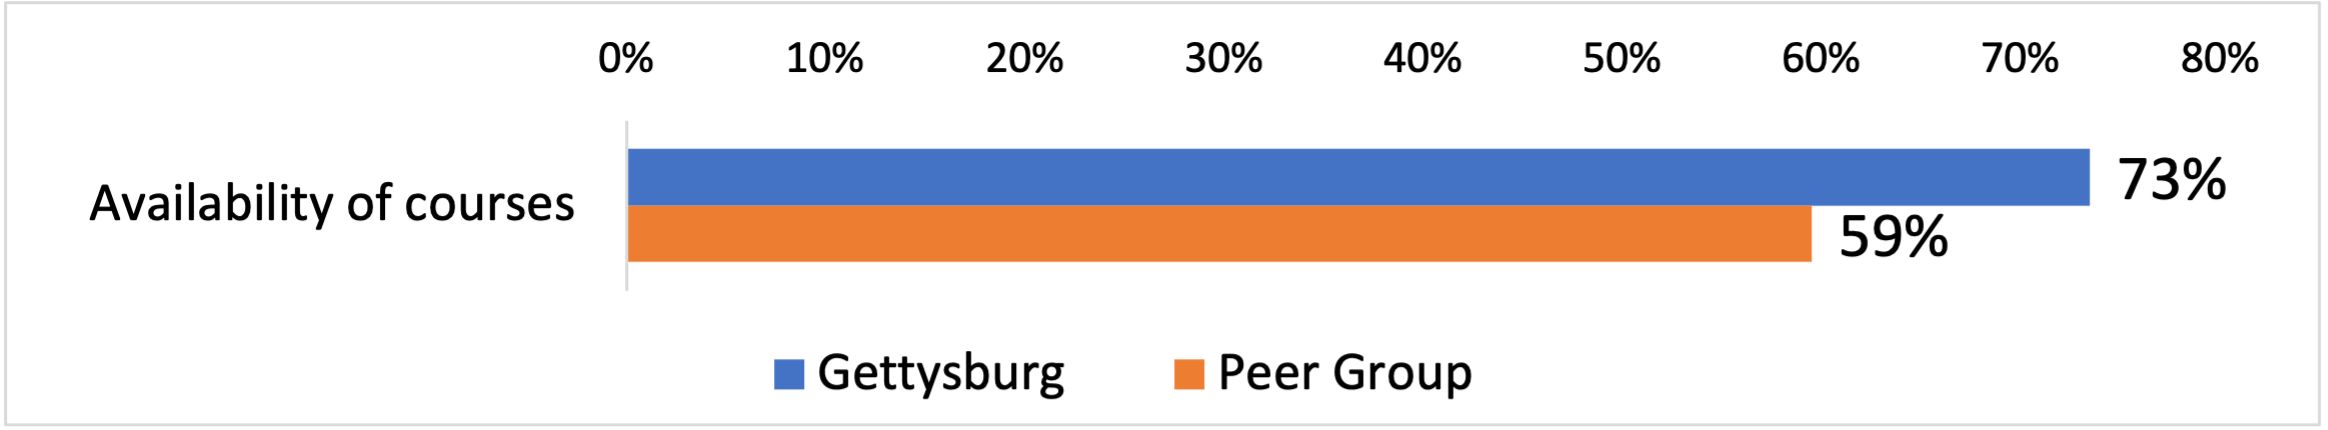
Additionally, seniors were asked to rate their satisfaction with 4 aspects of academic experiences. On average, Gettysburg seniors reported significantly higher satisfaction with availability of courses. The chart below displays % reporting being satisfied:
Interactions with Diversity
Overall, Gettysburg seniors reported significantly higher frequencies of interactions with diversity than seniors in the Peer Group. Gettysburg's average scale score for Interactions with Diversity (mean=3.33) was significantly higher than that of the Peer Group (mean=3.21) (based on a 5-point rating scale). Specifically, Gettysburg seniors reported more frequent engagement in the following:
- Attended a debate or lecture on a current political/social issue;
- Participated in a diversity or cultural awareness workshop;
- Had serious discussions with faculty or staff whose political, social, or religious opinions were different from my own;
- Had serious discussions with students whose political, social, or religious opinions were different from my own.
Participation in and Gains from High-Impact and Enriching/Extracurricular Experiences
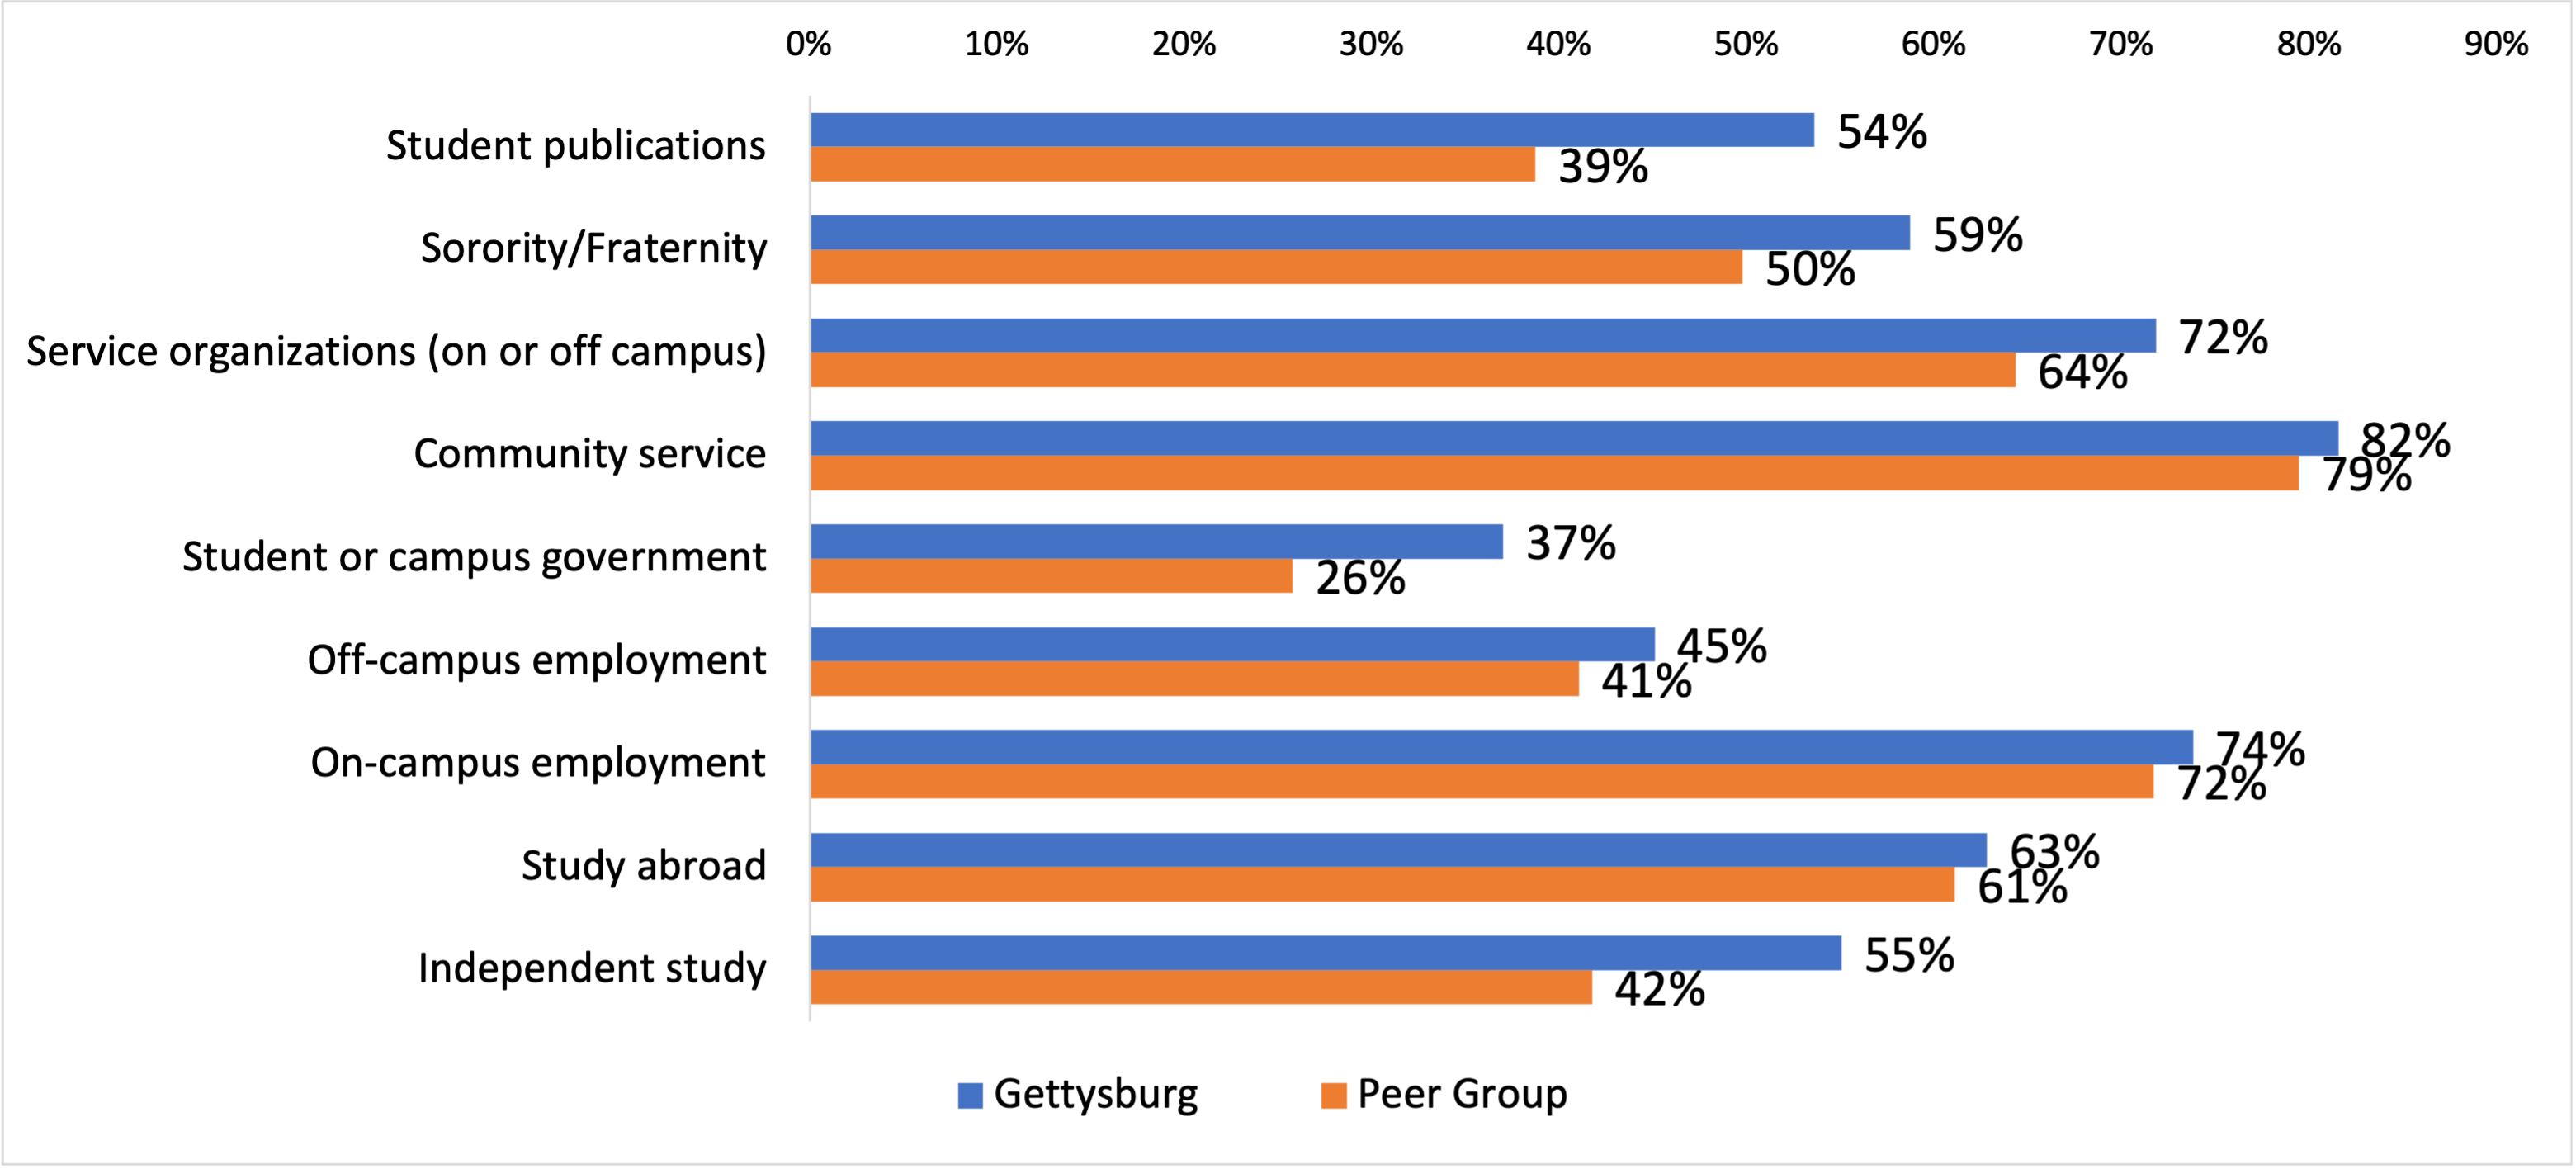
Compared with seniors in the Peer Group, on average, Gettysburg seniors reported significantly more frequent participation in the following 9 activities during their time at their current institution; the chart below displays the participation rate in these 9 activities. On the remaining 8 types of experiences (e.g., worked with faculty on research), Gettysburg's average score was similar to that of the Peer Group.
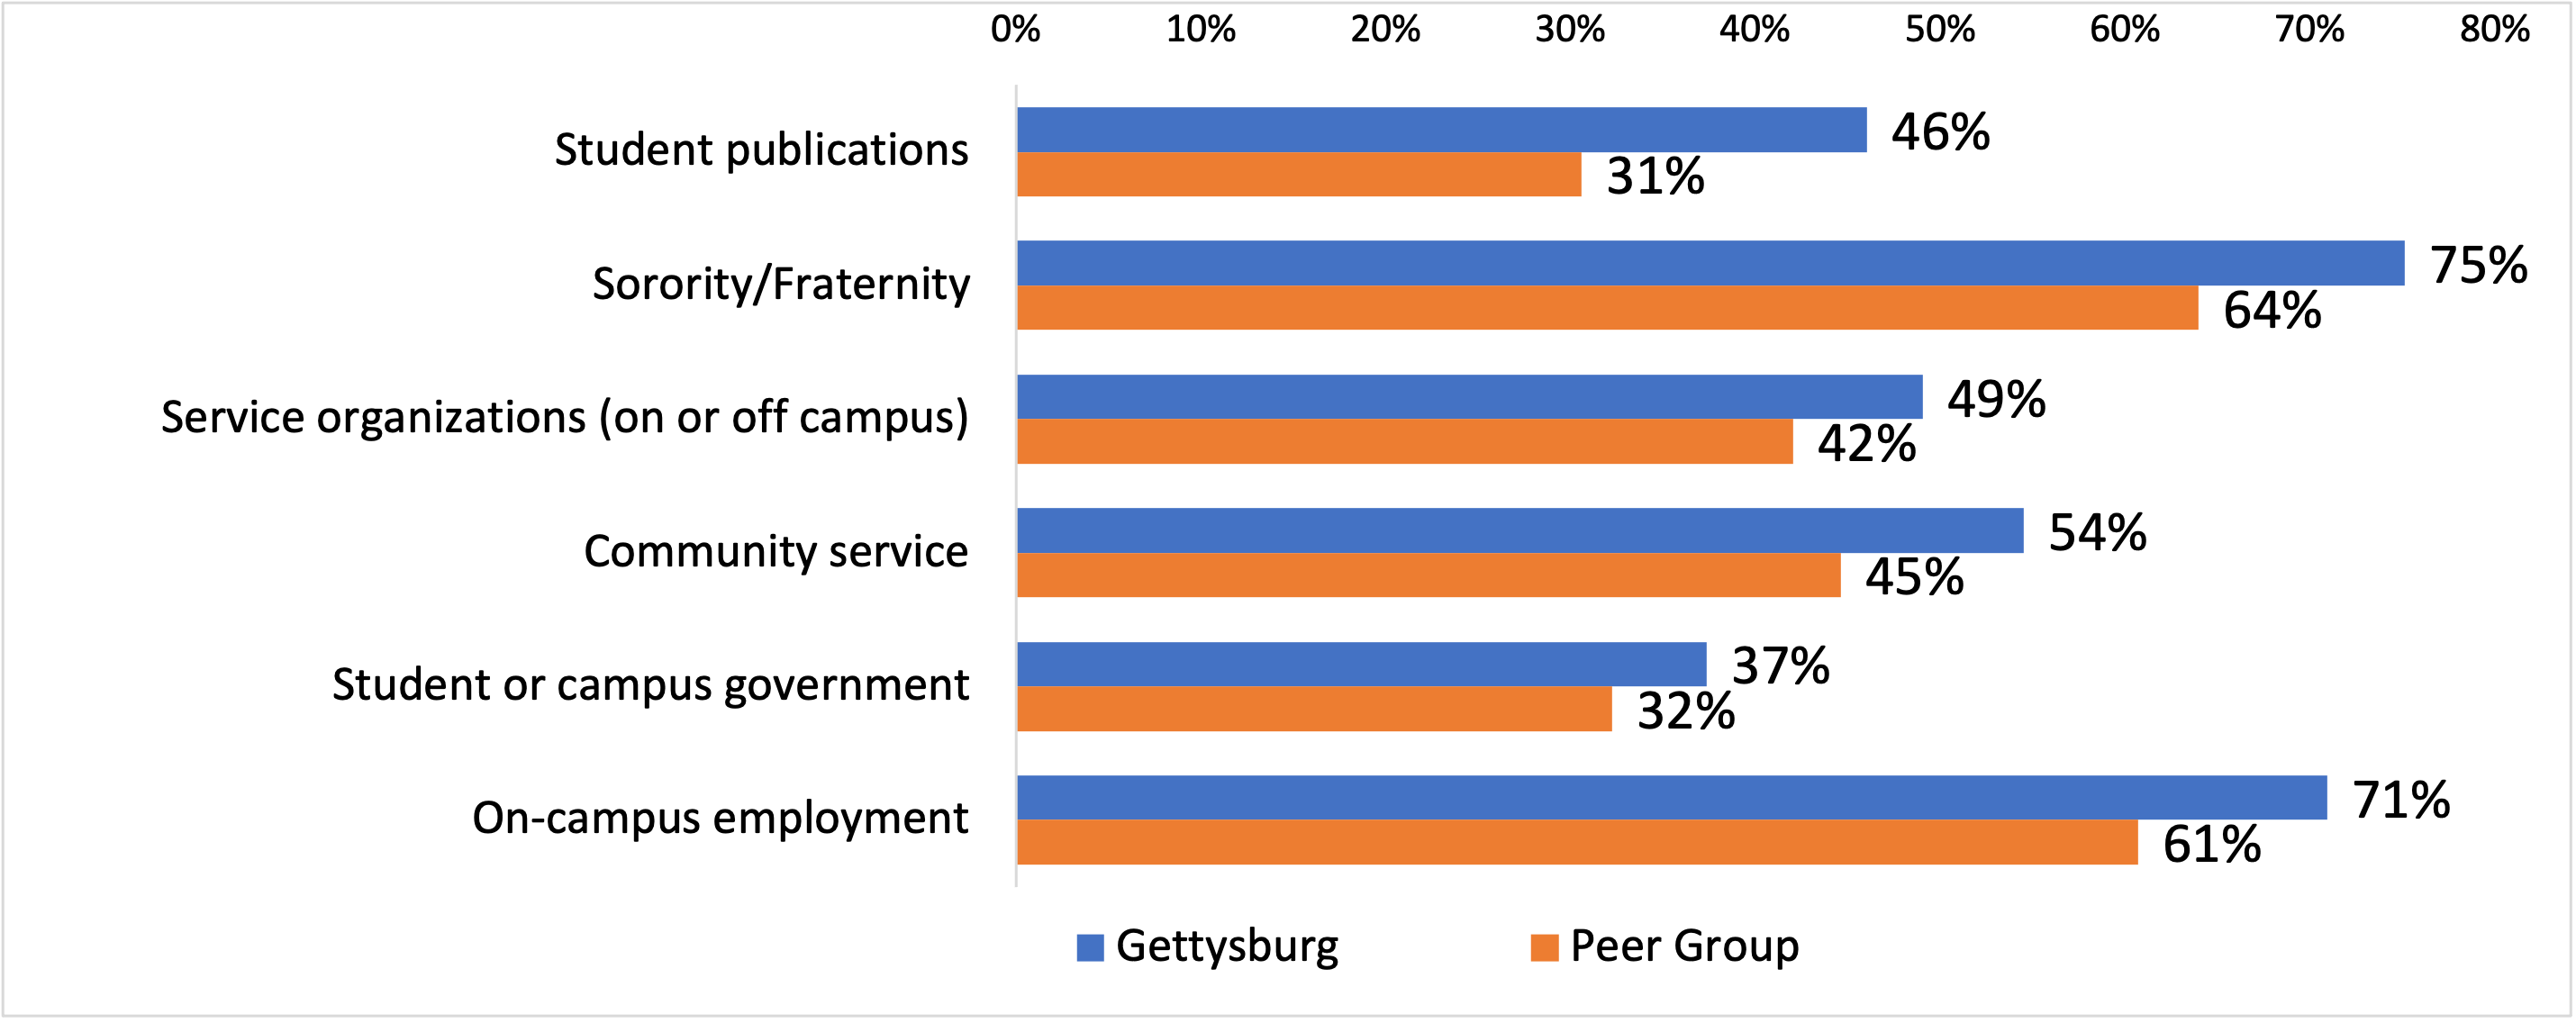
Seniors reporting having participated in a certain activity were then asked to rate the impact of participation. Compared with seniors in the Peer Group, on average, Gettysburg seniors reported significantly higher impact of the following 6 activities; the chart below displays % reporting that participation has substantially contributed to their learning and personal development. On impact of the remaining types of experiences, Gettysburg's average score was similar to that of the Peer Group.
Institutional Impact in terms of Preparing Seniors for Post-Undergraduate Life
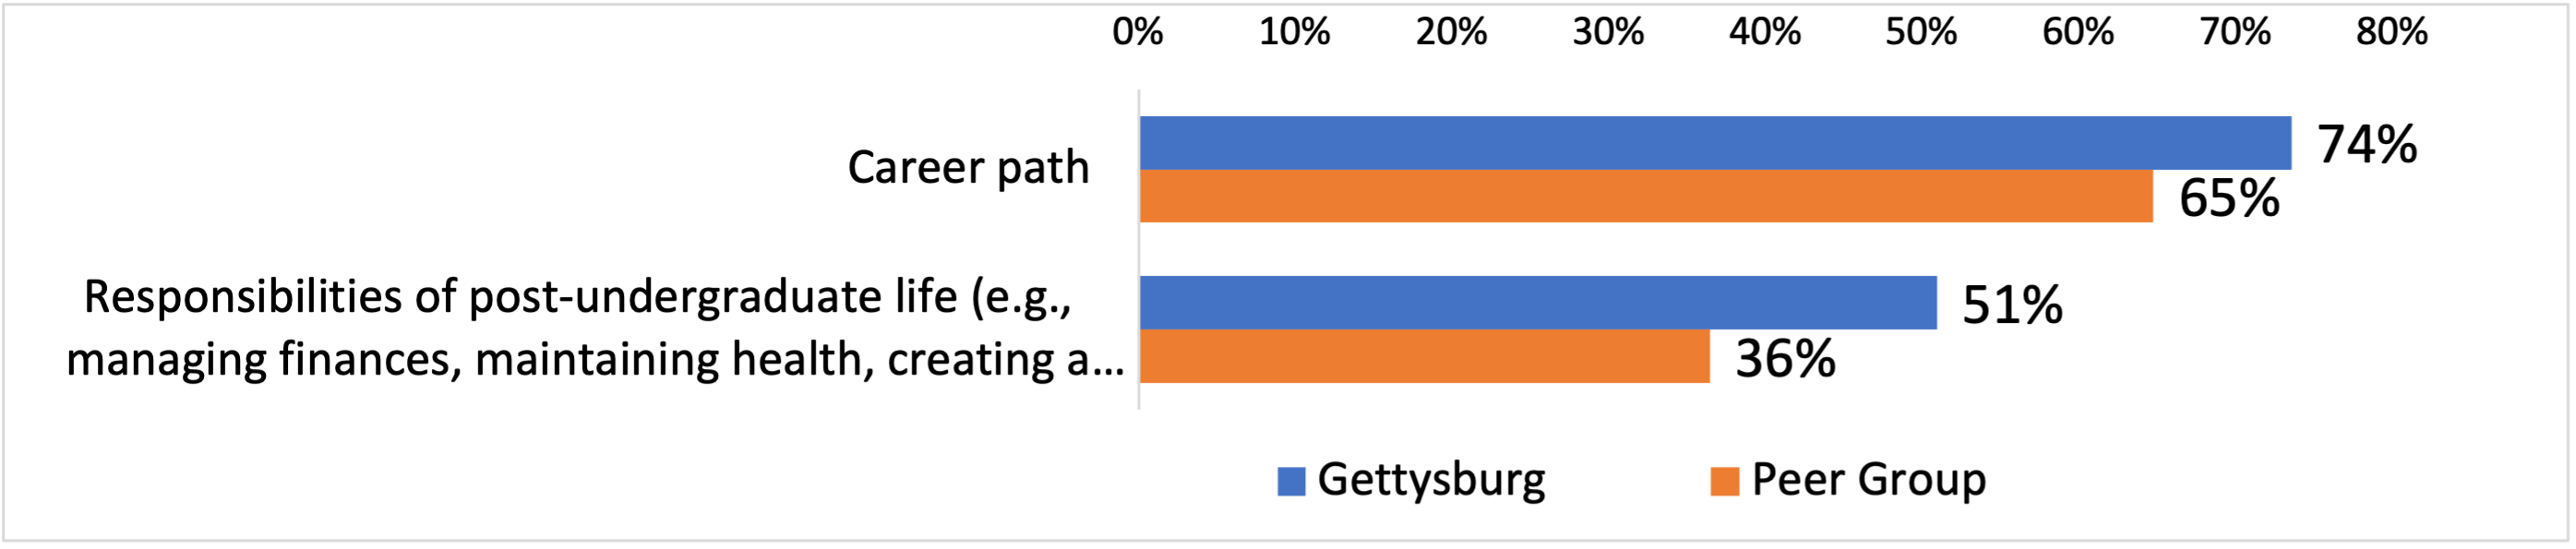
Compared with seniors in the Peer Group, on average, Gettysburg seniors reported more substantial institutional impact in term of preparing them for career path and responsibilities of post-undergraduate life. The chart below displays % reporting that their experiences at this institution have substantially prepared them for…
Challenges/Areas for Improvement
Compared with seniors in the Peer Group, on average, Gettysburg seniors reported significantly lower satisfaction with major advising and tutorial help or other academic assistance. The chart below displays % reporting satisfied with…

Note: A. Gettysburg's 2021 Peer Group included four private liberal arts colleges. One of them is located in the New England region; two, in the Mid-Atlantic area; and one, on the west coast. Two of them were ranked among the Top 20 national liberal arts colleges (based on the 2022 edi. U.S. News Best Colleges Rankings); one, among the Top 30; and one, among the Top 40. The % or mean of the Peer Group was calculated based on the combined unit-record dataset provided by HEDS.
B. Explanation for “substantially contributed” , “substantial impact”, and “substantially prepared”: On those questions, the survey used a Rating Scale: Very little (1)—Some (2—Quite a bit (3)—Very much (4). Displayed above is the combined % of those reporting “Quite a bit" or “Very much” (interpreted as “substantially” or “substantial”).
C. Explanation for “frequently”: On those questions, the survey used a Rating Scale: Never (1)—Rarely (2)—Sometimes (3)—Often (4)—Very often (5). Displayed above is the combined % of those reporting “Often" or “Very often” (interpreted as “frequently”).