

Gettysburg College Facts and Figures: Alumni Outcomes
Alumni employed or attending graduate school/pursuing further education within a year after graduating
Within a year after graduating from Gettysburg, 97 percent of the 2024 graduating class were employed or attending graduate school/pursuing further education.
| Status (within a year after graduating from Gettysburg) | 2024 Graduating Class |
|---|---|
| Employed | 73% |
| Attending graduate school/Pursuing further education | 24% |
| Subtotal: Employed or attending graduate school/pursuing further education | 97% |
| Other (Planning to attend graduate school; Volunteering) | 0.2% |
| Seeking employment | 3.3% |
First-Destination Career Outcomes of Prior Graduating Classes
| Status (within a year after graduating from Gettysburg) | 2015 | 2016 | 2017 | 2018 | 2019 | 2020 | 2021 | 2022 | 2023 |
|---|---|---|---|---|---|---|---|---|---|
| Employed | 78% | 78% | 80% | 79% | 76% | 74% | 76% | 79% | 74% |
| Attending graduate school/Pursuing further education | 20% | 20% | 18% | 19% | 22% | 24% | 23% | 19% | 24% |
| Subtotal: Employed or attending graduate school/pursuing further education | 98% | 98% | 98% | 98% | 98% | 98% | 99% | 98% | 98% |
| Other (Planning to attend graduate school; Traveling; Volunteering) | 1% | 1% | 0.8% | 0.5% | 0.4% | 0.2% | 0% | 0% | 0% |
| Seeking employment | 1.2% | 1.3% | 1.3% | 1.7% | 1.8% | 2% | 1% | 1.8% | 1.6% |
Note: (1) Graduates reporting being both employed AND attending graduate school/Pursuing further education were counted once and categorized based on their (supposed) primary activity.
(2) Multiple methods were used to collect graduates’ career outcomes data: exit surveys, alumni follow-up survey, and LinkedIn profile search. Data were collected at two points of time: near graduation (mid-April to early May), and then about 10-11 months after graduation. Many students accepted a job offer upon graduation, and the overwhelming majority of the remaining individuals planning to work found employment within six months after graduation.
(3) The response rate/knowledge rate (e.g., percent of the class whose career information was available at the time of the study) for the 2015--2024 Graduating Classes was 94%, 95%, 93%, 96%, 93%, 79% (2020 graduating class, pandemic year), 78%, 77%, 82%, and 86%, respectively. For more information, visit our interactive data tool: Outcomes Dashboard.
Graduate degree completion or enrollment five years after graduation
Five years after graduation (as of Fall 2021), 36.2 percent of the Gettysburg 2016 graduating class had received a graduate/professional degree; 12.3 percent were enrolled in a graduate degree program. After removing duplicates (i.e., those having received a graduate/professional degree and enrolled in a second graduate/professional degree program), 45 percent of this graduating class had received and/or were enrolled in a graduate/professional degree program five years after graduating from Gettysburg.
| Degree received | Percent (among alumni who received a graduate degree five years after graduating) |
|---|---|
| Second Bachelor's | 5% |
| Master's | 74% |
| Doctoral degree | 20% |
| Other degree | 1.6% |
| Total | 100% |
| Degree being pursued | Percent (among alumni who were enrolled in a graduate degree five years after graduating) |
|---|---|
| Master's | 46% |
| Doctoral degree | 52% |
| Other degree | 1.5% |
| Total | 100% |
Data Source: Five-Year-Out Alumni Outcomes Study conducted by the Office of Institutional Research (2016 graduating class; data collected in Fall 2021 through an on-line survey and LinkedIn profile search.)
Number of alumni who earned a research doctorate
During 1966-2024, 1,373 Gettysburg graduates earned a research doctorate from a U.S. institution; Gettysburg ranks 49th among liberal arts colleges.
| Period or Year | Total N of Gettysburg Graduates Who Received Research Doctorates | Rank among Liberal Arts Colleges |
|---|---|---|
| 1966-1975 | 254 | 38th |
| 1976-1985 | 271 | 32nd |
| 1986-1995 | 168 | 65th |
| 1996-2005 | 188 | 64th |
| 2006-2015 | 226 | 59th |
| 2016 | 31 | |
| 2017 | 28 | |
| 2018 | 40 | |
| 2019 | 19 | |
| 2020 | 24 | |
| 2021 | 23 | |
| 2022 | 28 | |
| 2023 | 36 | |
| 2024 | 37 | |
| 2016-2024 | 266 | 45th |
| Grand Total (1966-2024) | 1,373 | 49th |
Note. Only recipients of research doctorates are included (the most common research doctorate degree is the PhD); recipients of professional degrees (e.g., MD, DMin, PsyD) are not included. Rankings for the earliest four decades were based on the population of liberal arts colleges defined by the Carnegie Basic Classification 2018 Update. For the 2006-2015 decade and recent years, rankings were based on the population of liberal arts colleges defined by the Carnegie Basic Classification 2021 Update. Rankings were based on data collected by the National Science Foundation through the Survey of Earned Doctorates, which is an annual census of all new recipients of research doctorates at U.S. academic institutions.
Data Sources: National Science Foundation Survey of Earned Doctorates & Office of Institutional Research
Geographical distribution of alumni
Alumni reside in all 50 states, District of Columbia, Puerto Rico, Virgin Islands, Canada, and in 5 continents around the world.
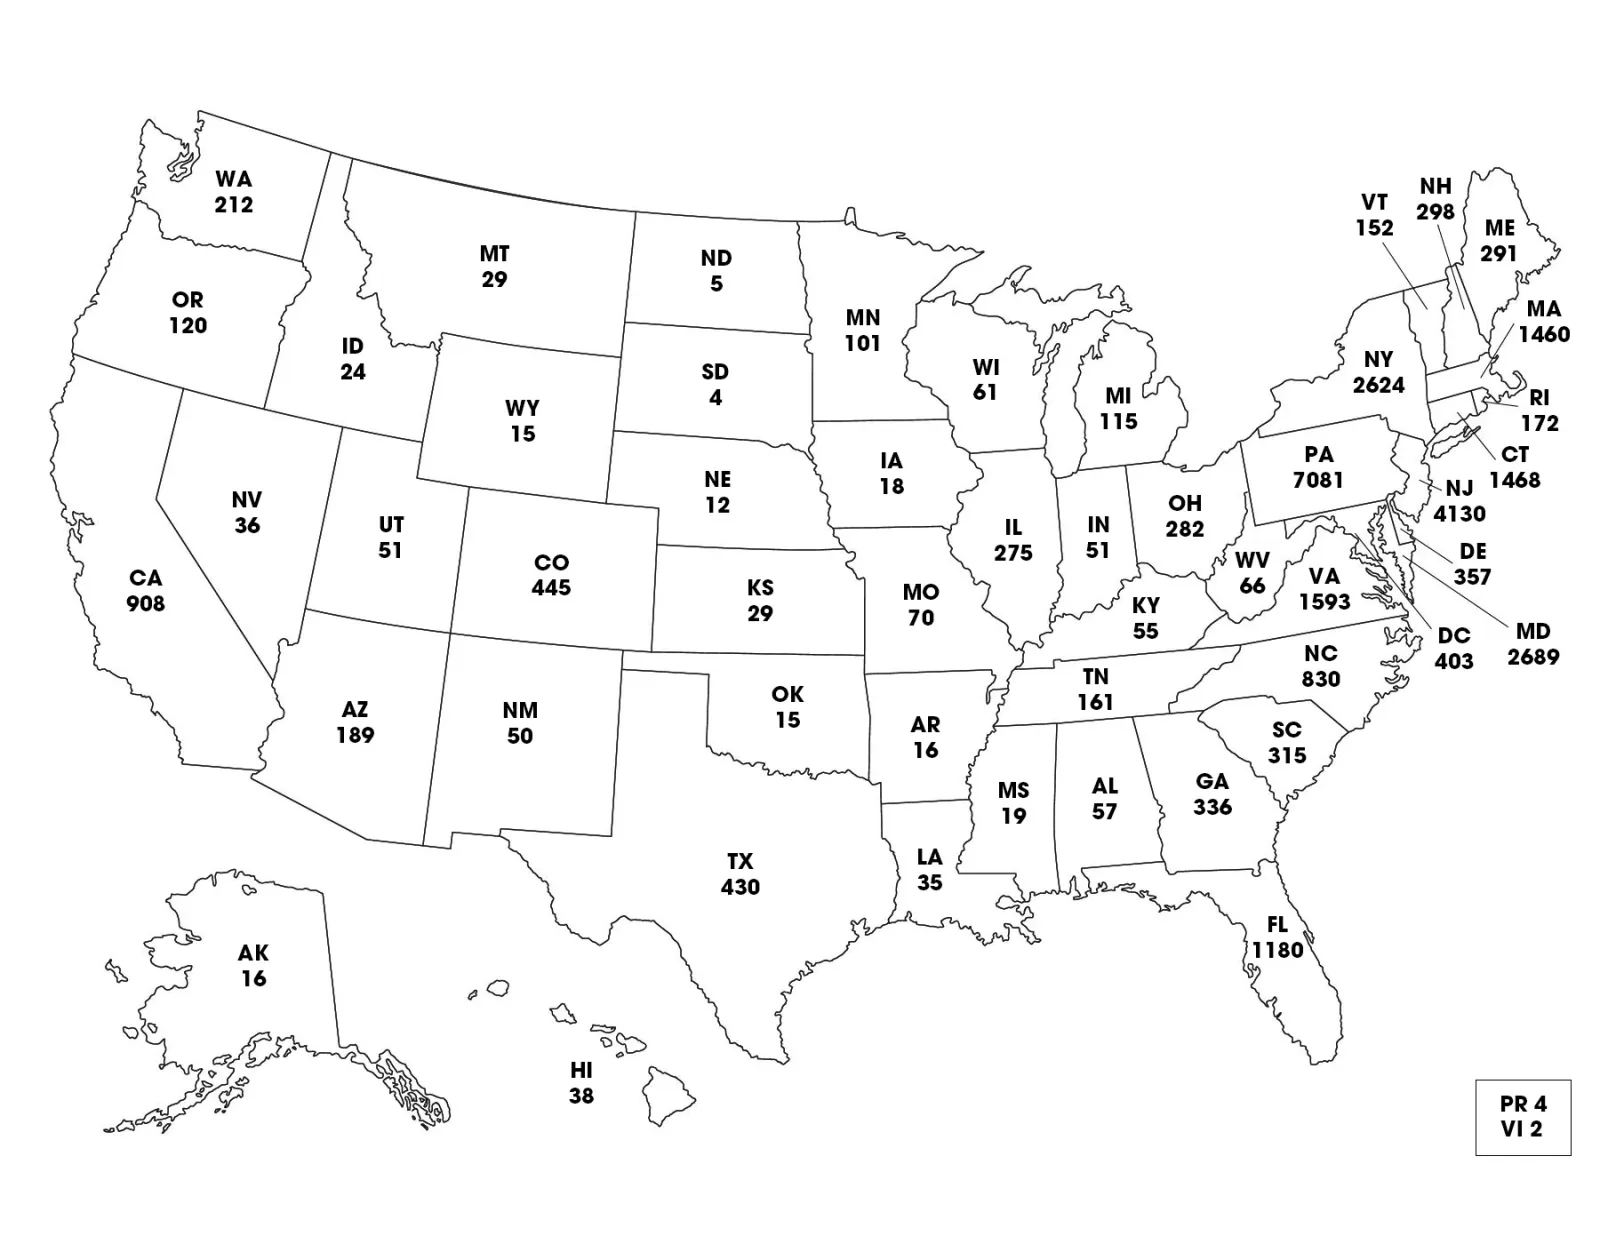
List of Alumni Distributions in the United States
| Alabama | 57 |
|---|---|
| Alaska | 16 |
| Arizona | 189 |
| Arkansas | 16 |
| California | 908 |
| Colorado | 445 |
| Connecticut | 1468 |
| Delaware | 357 |
| District of Columbia | 403 |
| Florida | 1180 |
| Georgia | 336 |
| Hawaii | 38 |
| Idaho | 24 |
| Illinois | 275 |
| Indiana | 51 |
| Iowa | 18 |
| Kansas | 29 |
| Kentucky | 55 |
| Louisiana | 35 |
| Maine | 291 |
| Maryland | 2689 |
| Massachusetts | 1460 |
| Michigan | 115 |
| Minnesota | 101 |
| Mississippi | 19 |
| Missouri | 70 |
| Montana | 29 |
| Nebraska | 12 |
| Nevada | 36 |
| New Hampshire | 298 |
| New Jersey | 4130 |
| New Mexico | 50 |
| New York | 2624 |
| North Carolina | 830 |
| North Dakota | 5 |
| Ohio | 282 |
| Oklahoma | 15 |
| Oregon | 120 |
| Pennsylvania | 7081 |
| Puerto Rico | 4 |
| Rhode Island | 172 |
| South Carolina | 315 |
| South Dakota | 4 |
| Tennessee | 161 |
| Texas | 430 |
| Utah | 51 |
| Vermont | 152 |
| Virgin Islands | 2 |
| Virginia | 1593 |
| Washington | 212 |
| West Virginia | 66 |
| Wisconsin | 61 |
| Wyoming | 15 |
Ready to Do Great Work?
