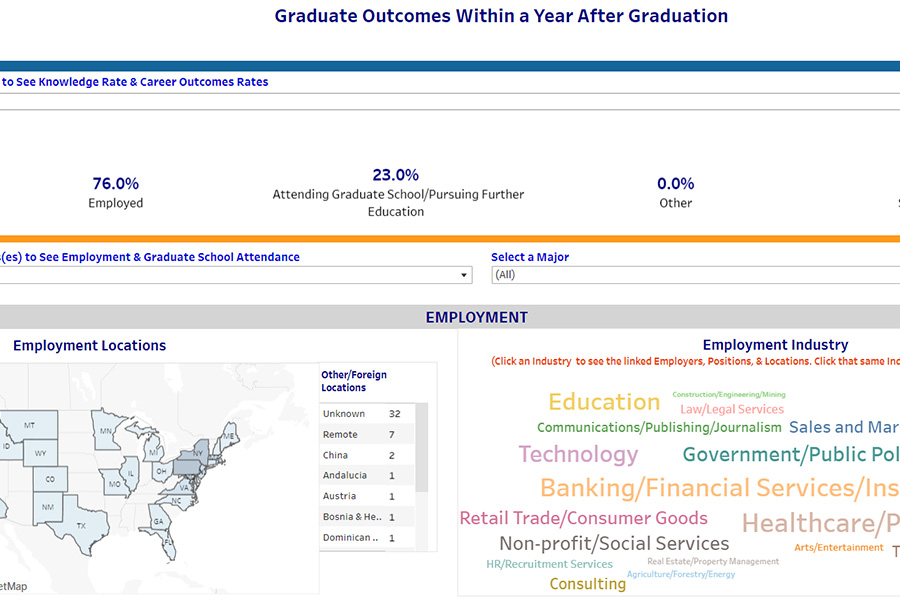
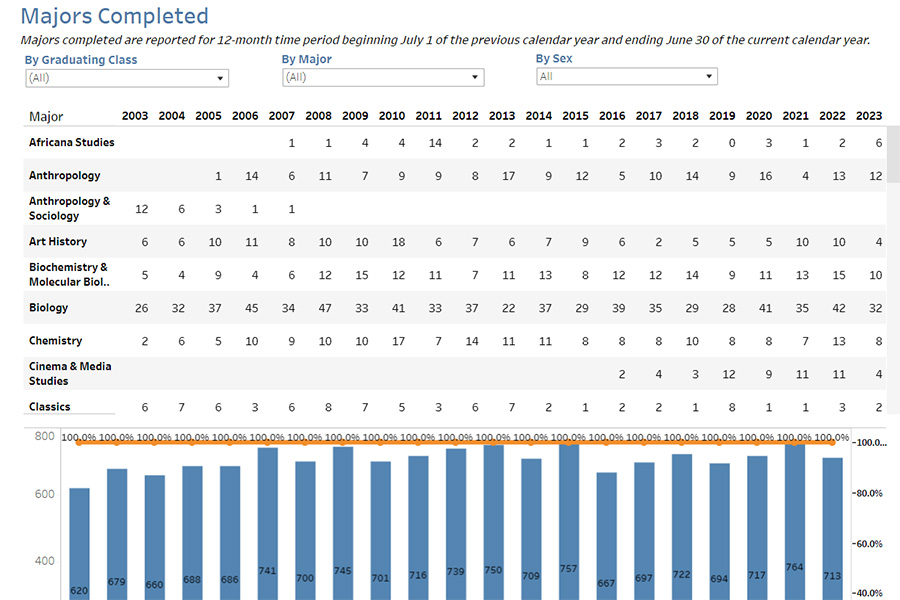
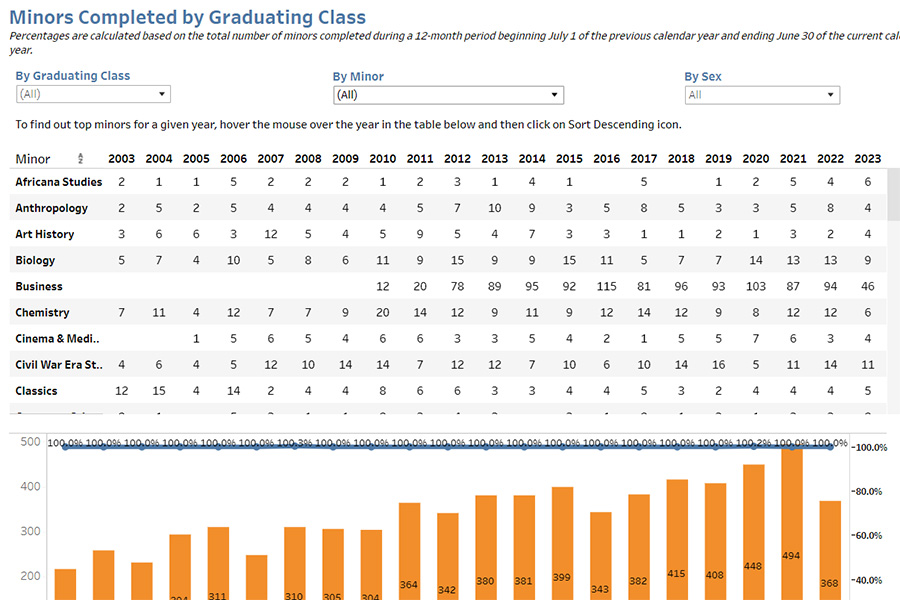
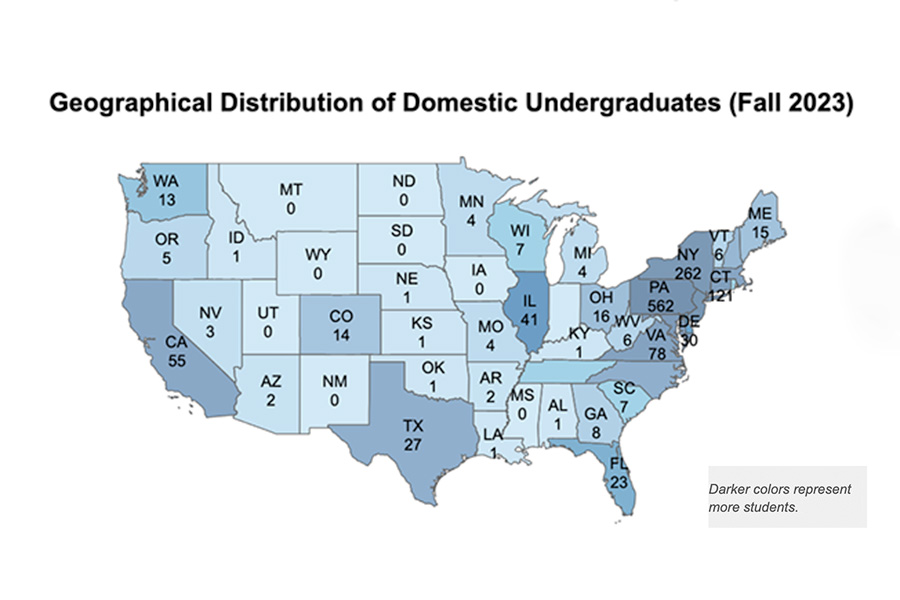
Using Tableau Desktop, the Office of Institutional Analysis created the following data visualizations--interactive dashboards displaying trends and outcomes. They are intended to promote understanding of the characteristics of the College, to inform students’ academic choices and career exploration, and to support data-informed curricular discussions and institutional planning. We recommend you view these dashboards on your desktop or laptop, as they are not entirely mobile friendly at this point given the large amount of data.
Data Visualizations